The trusted source of unique, data-driven insights on insurance to inform and empower consumers. Insurance Information Institute

Florida Homeowners Premium Growth Slows
as Reforms Take Hold, Inflation Cools

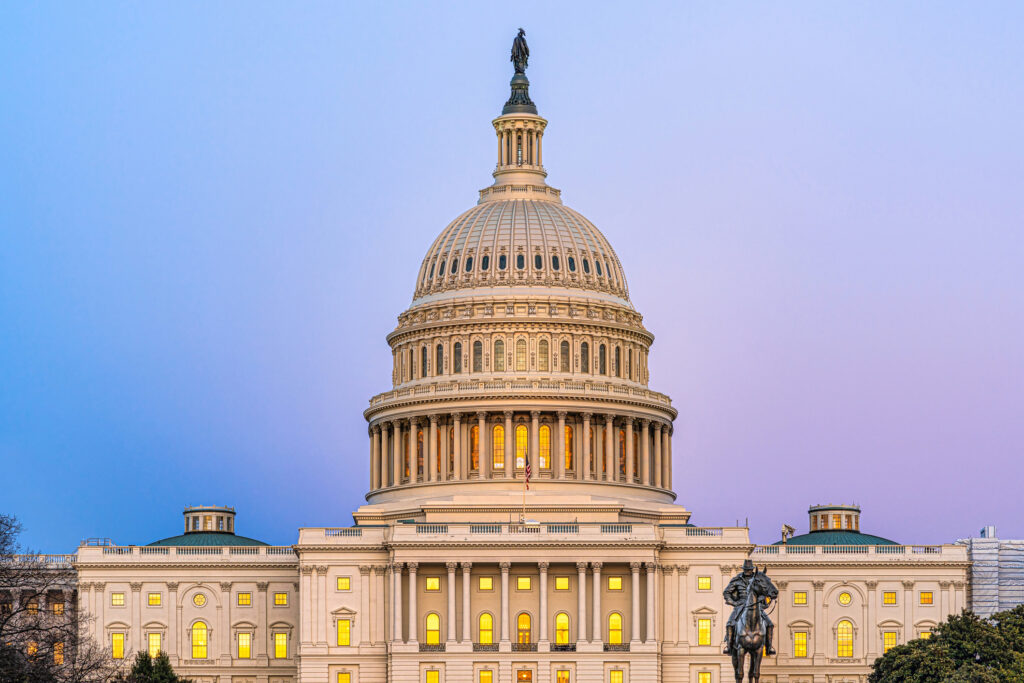
Historic Florida State Capitol Building Source: Getty Images

Homeowners insurance premium growth in Florida has slowed since the state implemented legal system abuse reforms in 2022, according to a Triple-I analysis.

As shown in the chart below, average annual premiums climbed sharply after 2020. This was due in part to inflation spurred by the COVID-19 pandemic and the war in Ukraine as well as longtime challenges in the state with claim fraud and legal system abuse.

Source: Triple-I analysis of NAIC and OIR data

According to the state’s Office of Insurance Regulation (OIR), Florida accounted for nearly 71% of the nation’s homeowners claim-related litigation, despite representing only 15% of homeowners claims in 2022, the year Category 4 Hurricane Ian struck the state. In that same year, and prior to Ian making landfall in the state as a first major hurricane since 2018’s Hurricane Michael, six insurers declared insolvency. Hurricane Ian became the second largest on record by insured losses, in large part because of the extraordinary litigation costs estimated to result in Florida in the aftermath.  

The Florida Legislature responded to the growing crisis by passing several pieces of insurance reform, primarily tackling problems with assignment of benefits (AOB), bad-faith claims, and excessive fees.  For example, the new laws eliminated one-way attorney fees in property insurance litigation, forbid using appraisal awards to file a bad-faith lawsuit, and prohibited third parties from taking AOBs for any property claims. The legislation also ensures transparency and efficiency in the claims process and encourages more efficient, less costly alternatives to litigation.  

A surge in litigation

Litigation spiked when backlogged courts reopened following the pandemic, then again when the reforms were passed in 2022 and 2023, as plaintiffs’ attorneys raced to file suits ahead of implementation of the legislation.

This increase in litigation, combined with persistently strong inflation, contributed to increased loss costs and premium increases. In 2022, average homeowners premium rates rose more than 17 percent, to $3,040. Premiums continued to rise in 2023, although at a decreasing rate, as inflation has moderated and legal reforms have kicked in.

There are early signs that the reforms are beginning to bear fruit. In 2023, Florida’s defense and cost-containment expense (DCCE) ratio – a key measure of the impact of litigation – fell to 3.1, from 8.4 in 2022, according to S&P Global. In dollar terms, 2023 saw $739 million in direct incurred legal defense expenses – a major decline from 2022’s $1.6 billion. For perspective, incurred defense costs in the two largest U.S. insurance markets in 2023 were $401.6 million in California, followed by $284.7 million in Texas. As the chart below shows, Florida’s DCCE ratio – even during its best years – regularly exceeds the nation’s.

As insurers have failed or left the state, Citizens Property Insurance Corp. – the state-run insurer of last resort and currently Florida’s largest residential insurance writer – has swelled with new business and lawsuits. Citizens’ depopulation efforts to move policyholders to private insurers contributed to policy counts falling to 1.23 million by the end of 2023.

It’s important to remember that all premium estimates are based on the best information available at the time and actual results may differ due to changes in market conditions. For example, earlier Triple-I projections that average annual homeowners premiums in Florida would exceed $4,300 in 2022 and $6,000 in 2023 assumed significant rate increases would be needed to restore profitability to the state’s homeowners market. These projections did not assume legislative reform or that Citizens would become the state’s largest homeowners insurance company, with many risks priced below the admitted and excess and surplus markets. Our projections also assumed inflation would continue to grow at rates similar to those prevailing at the time.

In light of the reforms and moderating inflation, we are now reporting lower average annual premiums of $3,040 (2022) and $3,340 (2023). The Florida OIR has reported average premium rate filings are running below 2.0 percent in 2024 year-to-date in the private market. Further, OIR indicated eight domestic carriers have filed for rate decreases and 10 have filed for no increase this year. Additionally, eight property insurers have been approved to enter the Florida market, with more expected this year.

Triple-I will continue to monitor and report on the evolving property insurance market in Florida.

Operating from the shadows, TPLF can create problems for judges and courts.

Hand with black sleeve holding a gavel, piles of documents

A recently published article, The Fifth Dimension: TPLF and Its Effect on the Judiciary, highlights the ways the rising specter of third-party litigation funding (TPLF) can create unnecessary challenges for the judiciary. 

Triple-I has published a great deal regarding the potential impact of TPLF on costs for insurers and policyholders. Bellino’s gaze focused on potential risks for the judiciary:

  • Increased judicial workload
  • More fraudulent claims
  • Longer litigation and slower settlements
  • Creation of potential appellate issues

And, like many insurance industry stakeholders, Lisa M. Bellino (VP Claims Judicial & Legislative Affairs for Zurich North America in Philadelphia) is fundamentally concerned about the lack of transparency surrounding TPLF’s involvement in a lawsuit.

TPLF is a growing and costly aspect of legal system abuse, a problem that Triple-I and other industry thought leaders define as policyholder or plaintiff attorney actions that unnecessarily increase the costs and time to settle insurance claims. Qualifying actions can arise, for example, when clients or attorneys draw out litigation in hopes of a larger settlement simply because TPLF investors take such a giant piece of the payout. As there is little transparency around the use of TPLF, insurers and the courts have virtually no leeway in mitigating any of this risk.

TPLF can lead to undue judicial burden and waste.

When judges are unaware of the funding arrangement, they would likely also be in the dark about potential conflicts of interest or improper claims and, therefore, be unable to mitigate these risks. However, Bellino argues that the de facto practice of secrecy can cause judicial waste even in the limited number of jurisdictions and courts that require disclosure. Judges may feel compelled to spend a significant amount of time ascertaining attorney compliance. As funding often involves parties not directly related to the case, the judiciary may need to hold additional hearings and reviews to uncover the real parties in interest. Bellino cites a case in which the real parties were not the named plaintiffs.

TPLF can be a driving factor behind lawsuit generation.

When law firms pursue class action litigation, they may engage “lead generators,” companies that help find plaintiffs for a specific tort. Advertising tactics can include traditional and social media. When prospective claimants respond to these ads, they are directed to a law firm or a call center that distributes the recruited claimants to law firms. This service comes at a steep price – in dollars and justice. As funding may often come from TPLF, Bellino describes how the profit model behind lead generation companies working with law firms can increase the risk of fraudulent claims.

The risk of bogus claims and claimants can surge with TPLF.

Funders of class action litigation have a financial incentive to drive up the number of plaintiffs. As neither the defense nor the judge is typically aware of the third party’s potential conflict of interests, judicial resources can be wasted, and justice can be delayed for legitimate claimants. Bellino cites, among other examples, a New York case to illustrate how litigation funders and attorneys may even collaborate in multi-million dollar fraud schemes.

TPLF funders may encourage drawn-out litigation and hinder settlements

Bellino cites a case highlighting how funders might control litigation and delay resolutions to maximize their returns. A publicly traded TPLF giant allegedly blocked a settlement agreement between a plaintiff and the defendants, resulting in prolonged litigation across multiple jurisdictions. The interference may have led to additional motions, hearings, and opinions, diverting judicial resources from resolving the dispute between the named parties. As a result, costs for the plaintiff, defendant, and the courts likely would’ve soared. 

Undisclosed TPLF involvement can spark appellate concerns.

Undisclosed funding agreements can also prevent parties from adequately preparing their cases and preserving appellate issues. For example, a TPLF investor may fund medical testing that leads to recruiting plaintiffs for a class action against a drug manufacturer.  If this fact wasn’t disclosed to the defendants or court, at the very least, the defendant wouldn’t have access to information needed for defense or subsequent appeals. Also, the judiciary wouldn’t be able to perform its duty to monitor red flags for potential bias or fraud. It is also possible that the interests of the plaintiff will be affected by other appellate concerns, too.

Increases in litigation and claim costs have threatened the affordability and availability of many areas of insurance coverage. TPLF involvement, like other channels for potential legal system abuse, is nearly impossible to forecast and mitigate. And despite its original intended purpose–to help plaintiffs seek justice– it can extract a disproportionate amount of value from settlements, weakening the primary purpose of a financial payout.

Overall, the shroud of secrecy around TPLF can undermine the legal system, posing threats to unbiased and fair legal outcomes. Bellino strongly advocates for mandatory disclosure of TPLF agreements at the beginning of litigation. A system-wide requirement for early transparency would allow courts and involved parties to address potential conflicts, biases, and fraud early in the process. In her words, “Disclosure may restore reality and close the door on the TPLF Twilight Zone.”

To learn more about how TPLF can impact costs for insurers and policyholders, take a look at our primer, What is third-party litigation funding and how does it affect insurance pricing and affordability? Our issue brief, Legal System Abuse: State of the Risk, can also provide more context on how TPLF fits into social inflation.  

Lightning-Related Claims Up Sharply in 2023

By Max Dorfman, Research Writer, Triple-I

The total value of lightning-caused homeowners insurance claims rose more than 30 percent in 2023, to $1.27 billion from $950 million in 2022, Triple-I estimates based on national claims data provided by State Farm.

The number of claims rose 13.8 percent during the same period, to 70,787 from 62,189, 10 states accounting for 57 percent of the total. The average cost per lightning-caused claim increased 14.6 percent, to $17,513 from $15,280.

“Rising inflation, including higher replacement, construction and labor costs impacted claim costs for the year,” said Triple-I CEO Sean Kevelighan. Triple-I released these estimates to in advance of Lightning Safety Awareness Week, which runs from June 23 to June 29.

“Lightning Safety Awareness Week highlights the dangers lightning poses to life and property and how insurers and policyholders are reducing these risks through effective mitigation efforts,” Kevelighan said.

Florida – the state with the most thunderstorms – remained the top state for number of lightning claims in 2023, with 6,003. However, Texas had the highest average cost per claim at $41,654.

Much of this damage is due to severe convective storms, which are among the most common, and most damaging natural catastrophes in the United States. The result of warm, moist air rising from the earth, these storms manifest in various ways, depending on atmospheric conditions – from drenching thunderstorms with lightning, to tornadoes, hail, or destructive straight-line winds.

Damage caused by lightning, such as fire, is covered by standard homeowners insurance policies.  Some homeowners policies provide coverage for power surges that are the direct result of a lightning strike. 

Top 10 States for Homeowners Insurance Lightning Losses by Number of Claims, 2023

RankStateValue of ClaimsNo. of  ClaimsAvg. Cost per claim
1Florida$104,544,2856,003$17,416
2Georgia$87,110,7615,161$16,877
3Texas$194,288,8884,664$41,654
4California$83,367,7914,608$18,090
5Alabama$54,981,7563,508$15,673
6Louisiana$35,167,3753,050$11,529
7North Carolina$35,544,2432,881$12,337
8New York$50,785,8482,458$20,659
9Pennsylvania$27,219,0442,214$12,296
10Tennessee$39,792,3302,136$18,630
Top 10 States$712,802,32036,684$19,431
Source: Insurance Information, State Farm ®

“Mitigating the risks of lightning strikes starts with a thorough assessment before a storm,” said Tim Harger, executive director at the Lightning Protection Institute, which provides resources for the design, installation, and inspection of lightning protection systems. “Lightning protection systems play a crucial role in safeguarding homes, businesses, and communities from the potential downtime and destruction caused by lightning strikes.

RELATED LINKS

Facts and Statistics: Lightning

Lightning Videos

The Dangers of Shoddy Lightning Protection System Installations

New Triple-I Podcast Focuses on Intersection of Economics & Insurance

By Marina Madsen, Research Analyst, Triple-I

Triple- I is pleased to present “All Eyes on Economics”, its new podcast series.

Hosted by Triple-I Chief Economist and Data Scientist Dr. Michel Léonard, PhD, CBE, the series equips listeners with insights to manage economic uncertainty at the intersection of economics and insurance. It features interviews with insurance practitioners, technologists, academics, educators, analysts, and economists from various industries who discuss their perspectives and how they integrate economic trends and developments into their day-to-day responsibilities.

Early episodes include discussions with:

  • Jennifer Kyung, Chief Underwriting Officer at USAA,
  • Ken Simonson, Chief Economist of the Associated General Contractors of America,
  • Dale Porfilio, Triple-I Chief Insurance Officer,
  • Sean Kevelighan, Triple-I CEO, and
  • Pete Miller, President and CEO at The Institutes.

Dr. Léonard brings more than 20 years’ expertise in senior and leadership positions as Chief Economist for Trade Credit and Political Risk at Aon; Chief Economist at JLT; Chief Economist and Data Scientist at Alliant; and Chief Data Scientist at MaKro. He also is adjunct faculty in New York University’s Economics Department.

Auto Insurers’ Performance Improves, But Don’t Expect Rates
to Flatten Soon

Several metrics that influence auto insurance premium rates are starting to improve, but it will take time for these improvements to be reflected in flattening rates, according to a recent Triple-I Issues Brief.

Direct premiums written and underwriting profitability improved dramatically in 2023.  Additionally, 2023 net written premium growth of 14.3 percent is the highest in over 15 years. These are great gains, but it’s important to remember that they come on top of results in 2022 that were the worst in recent years.

The number of drivers on the road and miles driven have returned to pre-pandemic levels – but the risky driving behaviors that led to high losses during the pandemic have not improved. More accidents with severe injuries and fatalities have driven up claims and losses in terms of both vehicle damage and liability, while attracting greater attorney involvement and legal system abuse. Compounding these conditions has been historically high inflation, which puts upward pressure on the material and labor costs, increasing the cost of claims.

Telematics technologies, which allow insurers to analyze risk profiles and tailor rates based on individual driving habits, offer the possibility of some relief. By providing feedback that can influence driving behavior, telematics has been shown to lower risk and help reduce the cost of insurance. An Insurance Research Council survey found 45 percent of drivers said they made significant safety-related changes in how they drove after participating in a telematics program. Another 35 percent said they made small changes.

But broader risk and economic factors are likely to keep premium rates high in most cases for the foreseeable future.

NCCI Event Shines a Light on Workers Comp

William Nibbelin, Senior Research Actuary, Triple-I

The recent National Council on Compensation Insurance (NCCI) Annual Insights Symposium (AIS) in Orlando, Fla., provided important context and clarity around the state of the workers compensation line of business. As a new senior research actuary for Triple-I, my prior knowledge of this line could best be summarized by the following words from one peer-reviewed study of a reserving project I conducted more than two decades ago: Long-tail, unprofitable.

I recently assumed responsibility for forecast modeling of the property/casualty industry, which includes workers comp. In this role, I’d seen the line’s 2023 net combined ratio at 87 – the lowest (ie., most profitable) in the past five years. But I did not yet have deep understanding of the underlying trends driving these numbers.

I saw the AIS as an opportunity to gain that knowledge, and the event delivered.

The net combined ratio of 87 – as reported by Triple-I using National Association of Insurance Commissioners (NAIC) data sourced by S&P Global Market Intelligence – was also the ninth straight calendar year in a row under 100. According to NCCI, the success of the workers comp line in recent years represents the convergence of three factors:

  • Payroll increases
  • Moderate severity increases, and
  • Larger-than-expected frequency declines.

 “The overall numbers for workers compensation show a financially healthy system,” said Donna Glenn, NCCI’s chief actuary.

Payroll increases

The line’s 2023 direct written premium (DWP) increased 2.6 percent nationally – due primarily to another strong year of payroll growth at 6.2 percent, according to NCCI.Rising wages contributed the most to that figure, with increases in all industry sectors resulting in a combined wage growth of 3.9 percent.  Improved job creation contributed 2.3 percent, with all sectors except transportation and warehousing seeing increased employment. Payroll growth was partially offset by state-approved premium rate decreases.

Moderate severity increases

Claim severity remains moderate year over year, at 3 percent in 2023, despite indemnity claim severity at 5 percent. Medical claim severity for 2023 trended at a low 2 percent, in line with the 20-year trend of 1.8 percent and below the 3.5 percent in 2022. Medical claims less than $500,000 increased 5 percent; however, claims above $500,000 decreased 16 percent, driven primarily by several large losses in 2022.

Also, more states have adopted physician medical fee schedules from 2012 to 2022, which has shifted medical cost category shares from more expensive inpatient claims to outpatient claims, as well as lower drug claims. Outpatient claims increased from 23 percent of all claims to 27 percent and drug claims decreased from 12 percent to 7 percent of all claims.

Larger-than-expected frequency declines

Overall claim frequency decreased 8 percent in 2023, compared to the 20-year average decrease of 3.4 percent. Workers compensation claims frequency has only increased twice in the past 20 years – once in 2010 from the destabilization in the construction sector in 2009 and again in 2021 from COVID-19 impacts in 2020.

From 2015 to 2022, workers comp claims frequency benefited from workplace safety improvements and technology advances, which helped the decline in all cause of injury categories, including the two largest shares of strain and slip/falls. During this same period, the largest decline in claim frequency by part of the body was in lower-back claims. Finally, the recent slowing employment market churn has also improved claim frequency as claims decline when job tenure rises.

Stephen Cooper, senior economist at NCCI, speaking on the state of the economy and its impact on workers comp, said job growth and steadily increasing wage rates continue to favor the workers compensation system. He also gave an overview of the contribution to labor force by age and generation from 1980 to 2030, including changes in claim share from 2020 actuals to 2030 forecasts. Overall, the double-digit growth in labor force of 24 percent in 2000 over 1980 and 18 percent in 2020 over 2000 is expected to fall to only 4 percent in 2030 over 2020.

The only age group with an expected increasing contribution to the labor force from 2020 to 2030 are those age 65 and older. The contribution to labor force for the age group 16 to 24 is expected to remain flat from 2020 to 2030 however their representative share of Workers Compensation claims has the largest expected increase from 9% to 11 percent.

Beyond the numbers

 The symposium provided valuable insight into several factors affecting workers comp, including the role of AI and innovation in workplace safety technology. In a panel moderated by Damian England, NCCI’s executive director of affiliate services, the audience got to see a demonstration of AI camera monitoring of warehouse employee activity and the use of wearable technology to highlight improper lifting techniques.

“It is clear that safety technologies will be a vital part of future safety initiatives,” England said. “They may even be a gamechanger for evaluating and improving workplaces and reducing injuries.”

AIS also touched on challenges facing today’s workers, from climate to mental health.

“Our new NCCI research shows worker injuries increase by as much as 10 percent on very hot days, as well as on wet and freezing days, compared to mild weather,” said Patrick Coate, NCCI senior economist. “High temperatures impact construction and other outdoor workers most, while cold and wet weather leads to a lot more slip and fall injuries.”

Anae Myers, assistant actuary at NCCI, focused on the difference between claims that include mental health diagnosis versus those that do not.

“New research from NCCI shows that claims exceeding $500,000 are 12 times more likely to be diagnosed with an associated mental condition during the course of treatment, underscoring the potential for the impact of mental health in large claims,” Myers said.

I left the conference with a better understanding of workers comp rate making and the indices to track for future forecasts. Many thanks to Cristine Pike and Madison White at NCCI for their hospitality and guidance, as well as to all the attendees who patiently provided their expertise and generously offered their support when I introduced myself to them and to this stunning line of insurance.

Dynamic trends in TPLF and securities class actions increase risks for insurers

An annual report on securities class actions from Cornerstone Research indicates the median settlement amount increased 11%, and the proportion of settlements of at least $100 million climbed to nearly two-thirds of the total settlement dollars in 2023.  

Research from Westfleet Advisors focused on third-party litigation funding (TPLF) for US commercial litigation suggests the David versus Goliath narrative surrounding the early years of the market is growing tenuous. The overall percentage of commitments allocated to Big Law continues to increase, from 28% in 2022 to 35% in 2023.  

These and other persistent upward trends in litigation, settlement, and other legal costs continue to have implications for insurers, the policyholders they serve, and, ultimately, consumer prices. 

Mega settlements and institutional investors as lead plaintiffs are increasing. 

Cornerstone reports that despite a more than 20% decline in the number of settlements, total settlement dollars remained approximately the same, standing at little over half of the 2016 peak.  

There were 83 securities class action settlements in 2023, with an approximate total value of $3.9 billion, versus 105 settlements in 2022, totaling $4.0 billion. Other highlights in the 2023 data: 

  • The median settlement amount of $15 million is the highest since 2010.    
  • The nine “mega” settlements in 2023–the highest annual frequency since 2016–ranged from $102.5 million to $1 billion. 
  • All of the mega settlements included an institutional investor as the lead plaintiff.  
  • Only 6% of cases settled for less than $2 million, the lowest percentage since 2013.  

Analysis indicates that settlements were also higher in cases involving certain factors: “accounting allegations, a corresponding SEC action, criminal charges, an accompanying derivative action, an institutional investor lead plaintiff, or securities.” Further, an increasing number of cases that settle at later stages involved an institutional lead plaintiff, continuing the trend from 2022.  

Results also suggest that drawing out cases can amplify other factors, such as total assets and median “simplified tiered damages,” a Cornerstone term that refers to the model used to estimate settlement amounts. For both of these categories in 2023, median amounts for cases after class certification rulings were twice that of cases that settled before these rulings were made. However, in the five-year period from 2019 through 2023, over 90% of cases were settled before filing a motion for summary judgment.  

Accompanying derivative actions are down. 

Whereas a securities class action is filed on behalf of shareholders, a shareholder derivative action is typically brought by a shareholder on behalf of and (arguably) for the benefit of the company (usually against the company’s directors and/or officers). Derivative actions typically only happen in parallel with class action lawsuits, and the majority don’t result in monetary settlements (except for attorney fees). Instead, the plaintiff wins tend to center around measures for reforming corporate governance or operational controls.  

Other research from Cornerstone shows the probability of a monetary settlement for these lawsuits increases when the associated class action settlement is rather large. Also, historically, securities actions with accompanying derivative litigation tend to settle for higher amounts than those that don’t carry parallel derivative claims. Thus, Cornerstone also tracks the percentage of cases involving accompanying derivative actions. In 2023, the portion was 40%, the lowest since 2011.  

New capital commitments decreased for commercial litigation TPLF, but claim monetization increased. 

With a reported 39 active funders, 353 new deals, and $15.2 billion AUM, commercial litigation (versus consumer litigation) receives the majority of third-party litigation funding (TPLF). Investors target intellectual property, arbitration, business torts, contract breaches, and, of course, class action suits. These TPLF deals, also referred to as transactions or commitments, are arranged between funders and corporate litigants or law firms. Westfleet Advisors’ most recent market report on TPLF is the fifth edition, and it covers transactions from July 1, 2022, to June 30, 2023. Some noted exceptions and data adjustments are described in the report. 

The report reveals that despite some funders leaving the market and a 14% decrease in new capital commitments, key data points remained close to amounts tracked for last year. For example, attorneys still make the majority of these deals with a 64% share of the agreements, in contrast to only 36% for clients. Patent litigation is still reaping the largest amount of funds for a single legal area, about 19% of new commitments. Figures for type of deal and average deal size also remain fairly stable.  

However, some annual numbers have increased, highlighting an ongoing strategic shift in TPLF use. For the third year in a row, the report noted a rise in capital allocated for the monetization of claims, with 21% (versus 14% in 2022) going to new commitments. The biggest law firms (ranked in the AmLaw 200 according to gross revenue) have increased their use of TPLF, snagging 35% of the new deals. Arguably, both trends weaken the “David vs Goliath” narrative, and commercial TPLF may evolve to be less about helping scrappy firms and plaintiffs and more about extracting profits from litigation.  

Drawn out litigation and more outsized settlements may have implications for insurance coverage

Triple-I and other industry thought leaders define Legal System Abuse as policyholder or plaintiff attorney actions that unnecessarily increase the costs and time to settle insurance claims. Qualifying actions can arise from attorneys or clients drawing out litigation to reap a larger settlement simply because TPLF investors take such a giant piece of the settlement pie. As there is little transparency around the use of TPLF, insurers and courts have virtually no leeway in mitigating any of this risk. 

Thus, as with other channels for potential legal system abuse, TPLF use is nearly impossible to forecast and mitigate. Increases in litigation and claim costs have threatened the affordability and availability of many other areas of insurance coverage. TPLF can impact product lines such as Directors and Officers (D&O) in commercial litigation via securities class actions. TPLF can produce a financially counterproductive effect for plaintiffs by extracting a disproportionate amount of value from settlements, weakening the primary purpose of a financial payout: to enable the claimant to restore losses.  

Nonetheless, insurers seek to carefully manage these risks through underwriting practices, policy exclusions, and setting appropriate reserves to mitigate the financial impact. Meanwhile, Triple-I and various other stakeholders have called for a regulatory rein-in on TPLF to increase transparency.  To keep abreast of the conversation, follow our blog and check out our regularly updated knowledge hub for Legal System Abuse. 

Personal Auto Line Propels Strong 1Q
P&C Insurance Results

Strong improvements in personal auto insurance results helped drive the U.S. property and casualty insurance industry to its second-highest net underwriting gain in any quarter since at least 2000, according to an S&P Global Market Intelligence analysis.

Just 12 months from its worst-on-record start to a calendar year – with a combined ratio of 102.2 – the industry generated a ratio of approximately 94.0. Combined ratio is a measure of underwriting profitability in which a ratio under 100 indicates a profit and one above 100 represents a loss.

While quarterly statutory data is insufficient to calculate combined ratios at the line-of-business level, S&P previously estimated that a direct incurred loss ratio of approximately 71.3 percent in the personal auto sector would have produced break-even underwriting results in the first quarter.

“Applying the same methodology to the first-quarter result of 66.7% yields an estimated combined ratio of 95.6,” S&P said. The industry’s full-year 2023 private auto combined ratio was 104.9.

On a consolidated basis across business lines, incurred losses increased only modestly, while net premiums earned continued to rise rapidly. This reflects the combination of continued top-line strength in many commercial lines of business and what S&P called “the hardest private auto pricing environment in 47 years.”

The industry also benefited from relatively mild catastrophe activity compared with the comparable prior-year period.

While these strong first-quarter results are noteworthy, it will take time to know whether they represent the start of a trend. Multiple severe convective storm events already have occurred in the second quarter, and the 2024 Atlantic hurricane season is forecast to be “extremely active.”

Personal auto’s recent improvements follow 2022 results that were among the worst in recent years.  The number of drivers on the road has returned to pre-pandemic levels, and the risky driving behavior that led to high losses during the pandemic has not improved. More accidents with severe injuries and fatalities have driven up claims and losses in terms of both vehicle damage and liability, attracting greater attorney involvement and legal system abuse.

Compounding these loss drivers has been historically high inflation, which puts upward pressure on the material and labor costs for both the auto and property lines.

Favorable first-quarter results are good news, but it’s important for policyholders and policymakers to remember that the current hard market wasn’t created overnight. It will take time for insurers’ performance and drivers’ rates to stabilize.

Less Severe Wildfire Season Seen; But No Less Vigilance Is Required

By Max Dorfman, Research Writer, Triple-I

This wildfire season is expected to be less intense than normal, but people in high-risk areas should be aware of and prepared for potential damage, according to Craig Clements, a professor of meteorology and climate science at San José State University.

“There are days people really need to be careful,” said Dr. Clements, who directs the Wildfire Interdisciplinary Research Center and is a Triple-I non-resident scholar. “High fire days are typically hot, dry, and windy. If there’s ignition, these fires can spread quickly, depending on the fuel type.”

Despite record-breaking conflagrations across the Northern Hemisphere in recent years, U.S. wildfire frequency (number of fires) and severity (acres burned) have been declining in recent years and in 2023 were among the lowest in the past two decades.

While that trend is positive – reflecting progress in prevention of human-ignited wildfires – it isn’t a reason for complacency.  Another long-term trend has been the doubling of the share of natural catastrophe insured losses from wildfires over the past 30 years, according to Swiss Re. This reflects the impact of a growing number of people living in the wildland-urban interface – the zone of transition between unoccupied and developed land, where structures and human activity intermingle with wildland and vegetative fuels.

A 2022 study in the journal Frontiers in Human Dynamics found that people are moving to areas that are increasingly vulnerable to catastrophic wildfires.

“They’re attracted by maybe a beautiful, forested mountain landscape and lower housing costs somewhere in the wildland-urban interface,” said University of Vermont environmental scientist Mahalia Clark, the paper’s lead author. “But they’re just totally unaware that wildfire is something they should even think about.”

To prepare, people should keep an eye out on the National Weather Service, social media, or watch the news, to ensure they are ready for any potential risks, and be on the lookout for Red Flag Warning days.

Dr. Clements also recommends referring to the National Interagency Fire Center website, which is updated daily for fire risks in particular regions. Triple-I suggests looking into the Wildfire Prepared Home designation program, which helps homeowners take protective measures for their home and yard to mitigate wildfire risks.

It’s also important for homeowners to remember that, following wildfires, rains can result in landslides and debris flows that often are not covered by insurance policies. It’s especially important to understand the difference between “mudslides” and “mudflow” and to discuss your coverage with an insurance professional.

Learn more:

2024 Wildfires Expected to Be Up From Last Year, But Still Below Average

Tamping Down Wildfire Threats: How Insurers Can Mitigate Risks and Losses

Mudslides Often Follow Wildfire; Prepare, Know Insurance Implications

Triple-I “State of the Risk” Issues Brief: Wildfires: State of the Risk

Accurately Writing
Flood Coverage Hinges on Diverse Data Sources

Flood risk is not only one of the most destructive perils facing property owners; it is among the most complicated forms of coverage for property/casualty insurers to underwrite. For decades, the private market wouldn’t cover flood risk, which is why the National Flood Insurance Program had to be established.

But improved data collection and the availability of practically unlimited computing power have changed the equation for insurers, according to Anil Vasagiri, senior vice president for property solutions at Swiss Re. In a recent Executive Exchange with Triple-I CEO Sean Kevelighan, Vasagiri discussed the developments that have helped turn flood from a nearly untouchable peril to a burgeoning area of opportunity for insurers.

Over 90 percent of natural catastrophes involve flood in some way or another.  Vasagiri said the ability to use multiple data sources in understanding flood conditions of specific properties helps insurers more accurately underwrite flood and help policyholders proactively address their own exposure to the peril. 

“Increased information leads to increased capacity,” Vasagiri said – a fact that bodes well for improving insurance availability and affordability and evidenced by the increased number of private insurers writing flood coverage since 2016.

The timing of the private market’s increasing appetite for flood risk is fortuitous, as it coincides with Risk Rating 2.0, NFIP’s new pricing methodology that aims to make the government agency’s flood insurance premium rates more actuarially sound and equitable by better aligning them with individual properties’ flood risk. As NFIP rates become more aligned with principles of risk-based pricing, some policyholders’ prices are expected to fall, while many are going to rise.

In the Executive Exchange, Vasagiri discussed the Swiss Re’s acquisition of Fathom – a U.K.-based company specializing in water-related risks – as part of the company’s ongoing commitment to helping close the flood protection gap.

Learn More:

Triple-I “State of the Risk” Issues Brief: Flood

Triple-I “Trends and Insights” Issues Brief: Risk-Based Pricing of Insurance

Lee County, Fla., Towns Could Lose NFIP Discounts

Miami-Dade, Fla., Sees Flood Insurance Rate Cuts, Thanks to Resilience Investment

Milwaukee District Eyes Expanding Nature-Based Flood Mitigation Plan

Attacking the Risk Crisis: Roadmap to Investment in Flood Resilience

Latest research and analysis