Ohio has enacted a law mandating greater transparency in third-party litigation funding (TPLF), adding to nationwide momentum to better regulate the practice.
Signed into law last week, House Bill 105 requires litigation funders to register with the Ohio attorney general before operating in the Buckeye State and to disclose funding agreements to the attorney general once the case resolves. Agreements with foreign persons or entities are altogether prohibited to mitigate “the grave risk posed by foreign actors that seek to interfere” with Ohio courts, the bill states.
To further protect consumers, the new law establishes clear disclosure requirements on funding fees and repayment limits as well as imposes caps on fees from consumer litigation funders. Both consumer and commercial funders are also barred from influencing case strategy, settlement decisions, and counsel selection, earning strong support from the state’s small business community.
TPLF occurs when outside investors profit from lawsuits by paying legal costs in exchange for a share of the settlement or judgment if the suit wins. In practice, this encourages prolonged and unnecessary cases and can culminate in extreme nuclear verdicts of $10 million or more, a substantial portion of which investors will collect, rather than the plaintiff.
Mark Friedlander, Triple-I’s senior director of media relations, told BestWire that these added expenses contribute to thousands of job losses and higher costs on everyday goods and services throughout Ohio, including the cost of insurance.
“Third-party litigation financing has evolved into a global multibillion-dollar asset class of dark money,” Friedlander said. “Without question, there needs to be more transparency and that’s why this legislation is so important.”
Ohio’s TPLF transparency framework follows in the footsteps of similar measures emerging across the U.S., such as those implemented in Colorado, Mississippi, Oklahoma, Tennessee, and Utah. While the mechanisms behind each state policy differ, all mandate clearer disclosure of financing agreements and prohibit those involving foreign TPLF.
Legislation in North Carolina that went into effect this month ranks among the most comprehensive, effectively banning TPLF with exceptions only for funding that is not contingent on courtroom outcomes.
“Across the country, state lawmakers are taking meaningful steps to address legal system abuse and the factors driving higher costs for consumers, businesses, and insurance markets,” said Triple-I CEO Sean Kevelighan. “This year’s legislative activity reflects growing recognition that issues such as third-party litigation funding, predatory legal marketing practices, and excessive litigation can create significant economic impacts.”
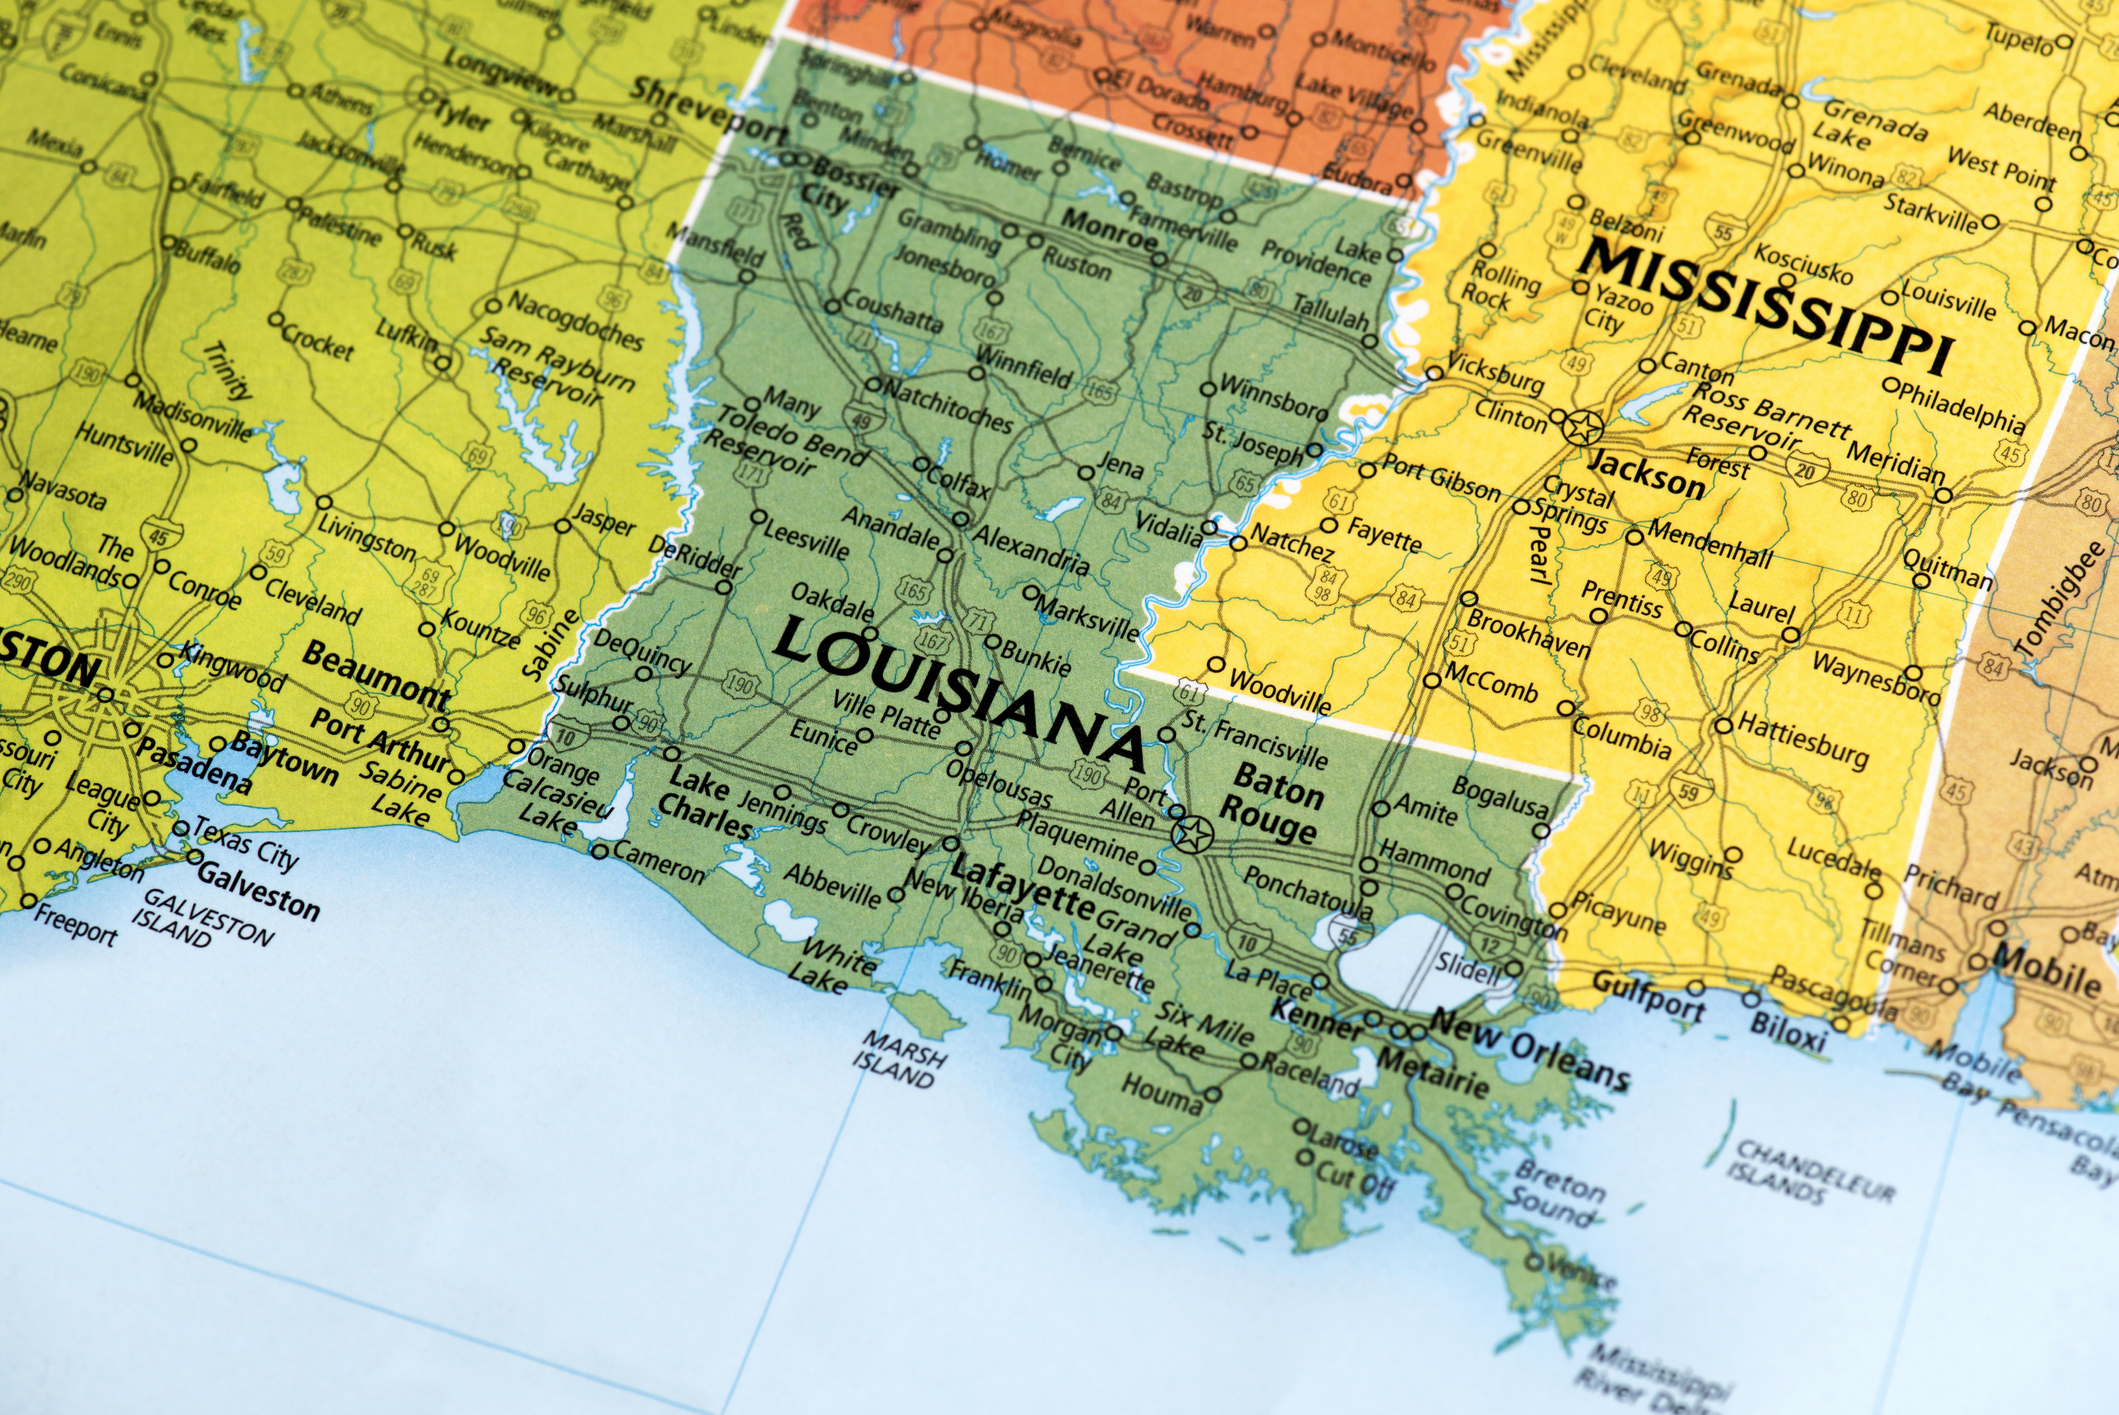
After years of rising premiums, Louisiana’s property/casualty insurance market posted its first broad rate relief this decade in 2025. A new Triple-I Issues Brief examines the drivers behind this shift and points to reforms needed to keep up the momentum.
Premium rates decreased statewide across all lines combined by an average of 0.4% in 2025, compared to consistent increases between 2021 and 2024. The sharpest turnaround came in private passenger auto, resulting in a statewide premium reduction of more than $340 million.
While homeowners insurance rates continued to rise, writers of the coverage are filing more rate decreases and fewer, less costly rate increases than in recent years, in part reflecting rising competition from the 17 insurers who have joined the state’s homeowners market since 2024.
Despite these improvements, combined ratio trends for homeowners’ insurers in the state underscore how much work remains. Though the line welcomed its fourth consecutive year of a combined ratio under 100 in 2025, hurricane-related losses caused the ratio to soar in 2020 and 2021, curbing full market recovery for decades to come. As such, the five-year average combined ratio in 2025 more than doubles the annual combined ratio to 130.5, representing a loss.
State lawmakers target cost drivers
Louisiana’s affordability challenges stem in part from a high rate of claims litigation, including a personal auto claims litigation rate more than twice the U.S. average. Bodily injury claims in the Pelican State are similarly disproportionate, at nearly double the U.S. average, as highlighted by Triple-I’s awareness campaign on the impacts of legal system abuse on Louisiana families and businesses.
A key player behind the litigation rate is misuse of assignment of benefits (AOB), or the practice by which policyholders sign over to a third party – a contractor, attorney, or public adjuster – their right to bill an insurance company directly for repairs or other services. Building on a broad AOB ban passed in 2023, Louisiana legislators recently enacted a law that includes claims for auto glass damage, a major source of fraud.
Based on model legislation from the National Council of Insurance Legislators (NCOIL), the law is one of several introduced throughout the country, including in Arizona, Florida, Kentucky, Maryland, New York, and Utah.
Another May 2026 measure expanded funding and eligibility for the Louisiana Fortify Homes Program, which offers homeowners up to $10,000 grants to upgrade their roofs to standards for severe storm and hurricane resilience. Secured with $80 million for 2026, the program is now available to residents in parishes farther inland to help mitigate rising flood risk among non-coastal communities.
While these efforts are starting to bear fruit on insurance premiums, overall expected losses will need to be reduced for insurance affordability to further improve statewide. Continued reforms targeting excess litigation and fraud are essential to promoting an insurance market accessible to all consumers.
As insurers increasingly turn to AI for opportunities to improve insurance affordability, they must also identify and mitigate the new, complex risks it introduces. A first-of-its-kind State of the Tech Policy Brief, developed by Triple-I’s AI Policy Council, explores how one pilot from the National Association of Insurance Commissioners (NAIC) seeks to establish an AI governance framework that can keep pace with AI and machine learning systems as they evolve.
Launched in March 2026, the NAIC pilot aims to provide regulators standards for assessing how insurers leverage AI without replacing existing market conduct or financial analysis. Such assessment centers around four optional “exhibits:”
Exhibit A asks insurers to quantify their AI use across business functions;
Exhibit B evaluates the existing governance structure;
Exhibit C focuses on the mechanisms behind high-risk AI systems, or those that could impact consumers or financial stability; and
Exhibit D captures AI data details.
Participating states include California, Colorado, Connecticut, Florida, Iowa, Louisiana, Maryland, Pennsylvania, Rhode Island, Vermont, Virginia, and Wisconsin. Carriers operating in these states can expect documentation requests and should prepare accordingly, such as by maintaining accurate AI inventories, defining human oversight protocols, and verifying models are working as intended.
Involvement in the pilot does not prohibit states from pursuing their own AI regulations, so insurers should continue monitoring legislative changes at the state level as the NAIC’s program remains active through September. Once complete, the program is up for consideration for formal adoption at the NAIC Fall National Meeting in November 2026.
New AI frontier emerges
While current regulatory discussions focus heavily on predictive and generative AI, the technology has already progressed toward another major wave: agentic AI.
Unlike AI tools that depend on human review to function, agentic models can operate independently and execute their own decisions, the brief explains. As such, governance practices must adapt to manage autonomous systems capable of acting without human interaction, raising the regulatory stakes dramatically.
“As insurers evaluate governance frameworks, key considerations include transparency, accountability, regulatory compliance, and consumer trust,” the brief emphasizes. “The approaches insurers develop today will help inform how AI is deployed, monitored, and governed across the insurance value chain going forward.”
By Jeff Dunsavage, Head of Research Publications and Insights, Triple-I
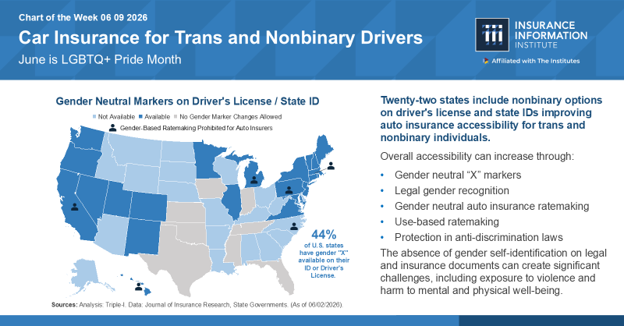
Gender is one of many factors insurers consider when looking at a driver’s risk profile, as permitted or prohibited by state laws and regulations, using the gender indicated on drivers’ licenses. Twenty-two states currently provide – in addition to “male” and “female” designations – non-binary gender identity options or do not require gender to be listed at all.
What are the insurance implications, if any and where permissible by state law, of a non-binary gender marker or the absence of any gender marker on a driver’s license? The short answer is that state-by-state differences in the relevant data limit the impact.
State use of gender markers
As of June 2026, 22 states allow an “X” gender marker on state IDs and driver’s licenses, representing 44 percent of the country. Interpreted in some states as a “not specified” gender, the X marker is widely regarded as a gender-neutral option for those who are not exclusively male (“M”) or female (“F”), which may include trans, nonbinary, and/or intersex individuals. Oregon became the first state to authorize the designation in 2017, following in the footsteps of similar laws in several other countries.
Within states that offer X markers, residents may update their gender marker to F, M, or X with varying degrees of ease, depending on state process requirements. Residents outside these states are limited to F or M designations, with gender marker corrections on state IDs and driver’s licenses altogether prohibited in at least eight states.
By population, 51 percent of trans adults live in states that allow these F, M, or X marker updates. Twenty-two percent live in states that bar these changes, according to estimates from the Movement Advancement Project. This figure could grow as legislation restricting the legal recognition and rights of trans people ramps up across the country, with nearly 800 such bills under consideration so far this year, 60 of which have passed. More than one thousand were considered in 2025, marking the sixth consecutive record-breaking year for such proposals.
Risk-based pricing
“Risk-based pricing” is a basic insurance concept that might seem intuitively obvious when described – yet misunderstandings about it frequently sow confusion. Simply put, it means offering different prices for the same level of coverage, based on risk factors specific to the insured person or property. If policies were not priced this way – if, for example, insurers had to come up with a one-size-fits-all price for auto coverage that didn’t consider vehicle type and use, where and how much the car will be driven, and so forth – lower-risk drivers would subsidize riskier ones.
Little uniform data currently exists, however, on accident trends among trans and nonbinary drivers. As a result, it’s unclear whether or how rates might be affected for those with an X gender marker or for those without an updated gender marker of any kind.
Telematics can help
A 2021 article from the National Association of Insurance Commissioners’ (NAIC) Journal of Insurance Regulation, as well as a 2024 Casualty Actuarial Society (CAS) study, point to the promise offered by telematics and usage-based technologies. The NAIC Journal article recommends abandoning gender as a rating factor, arguing that “technology has advanced the opportunity to more directly measure actual driving behavior and exposure through other predictors.” The CAS study suggests telematics can “significantly reduce the need to include age, sex, and marital status in the claims frequency and severity models.”
While acknowledging “not all of the sensitive variables we tested could be eliminated from the model,” the CAS study went on to say, “The analysis shows there is still value in insurers testing the addition of telematics to their models to potentially reduce reliance on sensitive information that could result in actual or perceived bias.”
Commitment to fairness
Fair, accurate pricing and underwriting are at the heart of the risk-based approach, and property/casualty insurance industry is committed to ensuring fairness and promoting trust across all the communities it serves. Insurers and the actuaries and data scientists that support them are well positioned to continue helping policymakers and decisionmakers understand the complex science of risk and play a constructive role in the policy discussion.
By William Nibbelin, Head of Industry Data and Actuarial Research, Triple-I
The U.S. personal auto insurance market achieved its strongest underwriting performance of the post-pandemic era in 2025, recording a net combined ratio of 91.8. According to Triple-I’s latest Issues Brief, this marked a significant improvement from the line’s 95.3 ratio in 2024, signaling a welcome return to profitability for a sector that commands more than a third of the entire domestic property and casualty insurance industry.
Combined ratio is the most common measure of insurer underwriting profitability. It is calculated by dividing the sum of the claim-related losses and expenses by premium. A ratio over 100 indicates the industry is paying out more than it is taking in.
Premium growth stabilizes
The road to this recovery required substantial rate adjustments. Following the pandemic, the auto insurance market experienced two back-to-back years of double-digit premium growth, climbing by 14.4 percent in 2023 and 12.8 percent in 2024. These hikes allowed insurers to keep pace with skyrocketing inflation and supply-chain disruptions.
In 2025, however, net premium growth cooled to a manageable 4.0 percent, landing just below the broader industry average. This deceleration indicates rates are finally settling as the macroeconomic forces that previously drove up costs begin to ease, particularly vehicle replacement and repair costs.
For the first time since 2019, key economic indicators—such as the Consumer Price Index for used cars, new vehicles, and automotive parts—recorded notable decreases over the 2023 to2024 period. Because insurer rate adjustments historically mirror vehicle pricing trends with a slight time lag, the drop in costs has helped pave the way for a calmer pricing environment.
Auto liability severity gap expands
While overall loss ratios have improved from their late-2022 peak, recovery has not been uniform across all types of auto coverage. The industry has experienced a widening gap between physical damage claims (covering vehicle repairs) and liability claims (covering injuries and legal costs).
Repairing physical damage has become significantly more efficient as supply chains normalized, causing loss ratios in that segment to drop sharply. In fact, by 2025, the cost index for physical damage dipped below its 2022 level, aided by a steady drop in overall claim frequency.
Auto liability has proven far more stubborn. Though accident frequency remains below pre-pandemic baselines, the average financial severity of liability claims has surged. Between 2019 and 2025, the average cost per liability claim jumped by 67.5 points. As a result, the financial gap between resolving a physical damage claim versus a liability claim reached a ten-year high by the end of 2025.
Market options
Market competition determines how many choices consumers have when shopping for a policy. On a nationwide scale, the personal auto market sits in a moderately concentrated zone, though it has become noticeably tighter since 2022 as larger carriers expanded their footprint.
On a state level, drivers in Rhode Island, Louisiana, Arkansas, and the District of Columbia face the most consolidated markets, where a handful of dominant carriers handle the bulk of the business. Conversely, Connecticut, Massachusetts, and California boast the least concentration and the most choices among carriers.
Legal system abuse remains a roadblock
While vehicle prices have leveled off, legal system abuse continues to be a major cost driver, especially for auto liability. This trend includes a rise in aggressive litigation, attorney involvement, and exceptionally large jury payouts generated by third-party litigation funding networks.
A study by Triple-I and the Casualty Actuarial Society revealed that these legal tactics inflated auto liability losses and defense costs by an estimated $91.6 billion to $102.3 billion over a ten-year period ending in 2024. This form of inflation is detached from the tangible economy, representing a systemic cost that ultimately impacts consumer premiums.
Fortunately, states like Florida, Georgia, and Louisiana have recently enacted meaningful legislative reforms designed to curb legal system abuse, which have already begun yielding positive results. While the specific policy levers may differ, their efforts demonstrate the kinds of targeted statutory changes that can effectively lower legal overhead and bring pricing relief back to policyholders nationwide.
Loretta Worters, Vice President, Media Relations, Triple-I
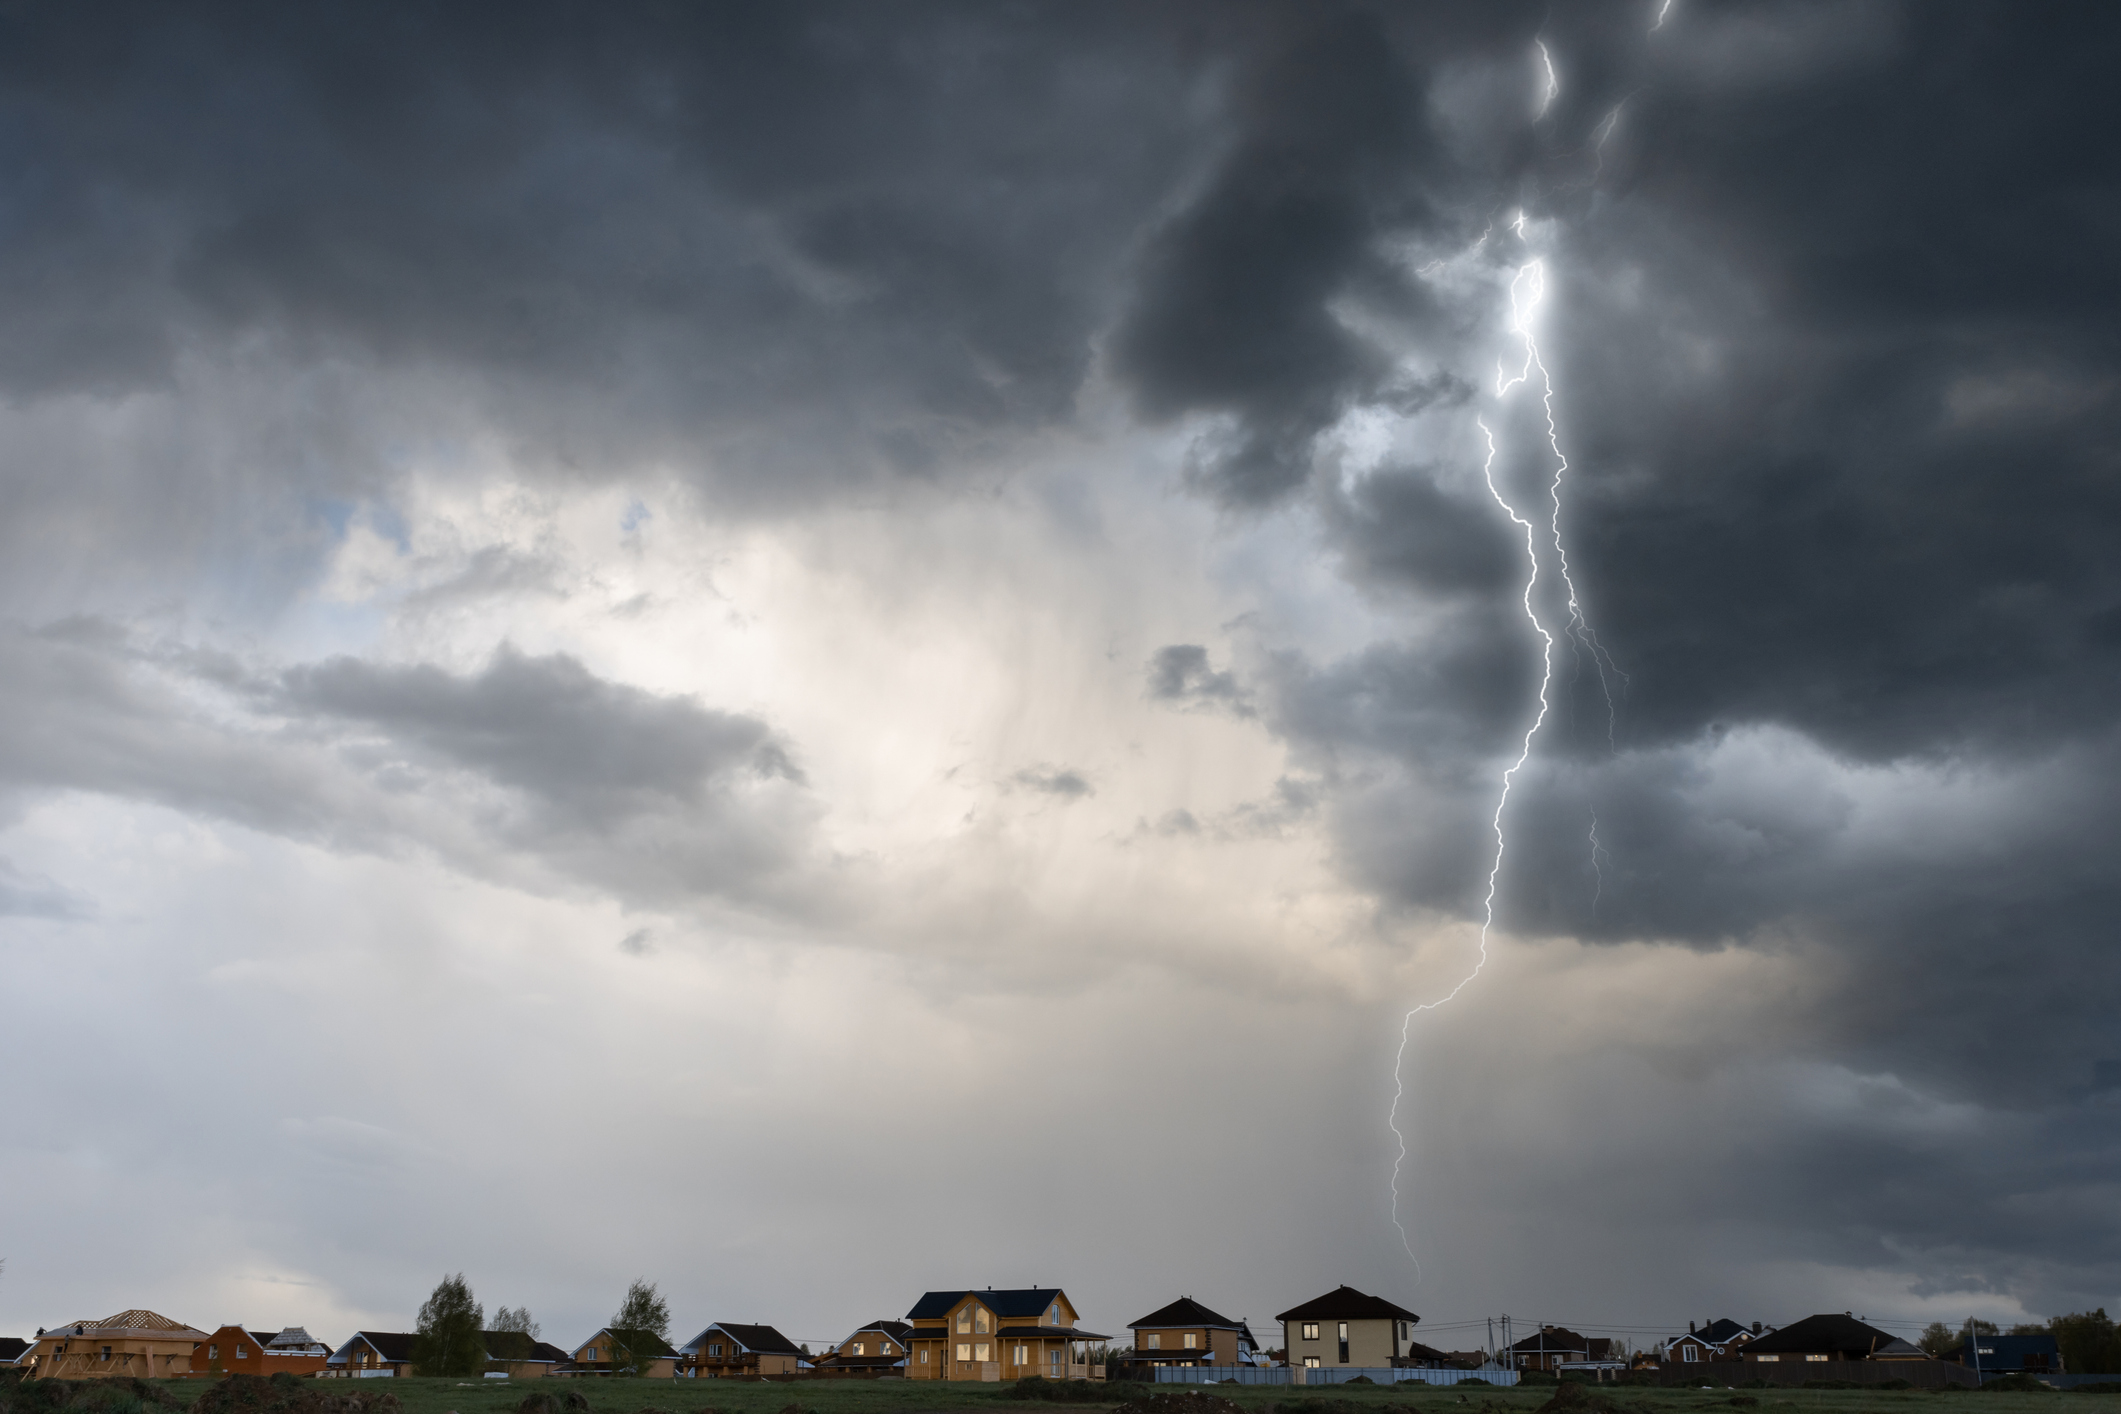
Lightning may last only a fraction of a second, but the damage it leaves behind can linger for months and cost thousands of dollars to repair.
U.S. insurers paid an estimated $1.65 billion in lightning-related homeowners insurance claims in 2025, a 59 percent increase from the $1.04 billion paid in 2024. The number of claims rose more modestly, up 11.6 percent to 61,986, but the average cost per claim jumped nearly 43 percent, reaching $26,616.
The findings, released during National Lightning Safety Awareness Week, highlight a growing challenge for homeowners. Lightning losses are becoming significantly more expensive, even when storms themselves are not necessarily becoming more frequent.
Several factors are contributing to rising claim costs. Inflation has increased the cost of labor, building materials and replacement parts, while reconstruction costs remain elevated across much of the country. At the same time, homeowners are insuring larger homes, more valuable personal property, and increasingly complex household systems, all of which can add to repair and replacement costs when lightning strikes.
Broader economic pressures, including rising reconstruction costs, inflation and legal system abuse, continue to drive up the cost of property losses across the country. These trends are making lightning-related claims more expensive and reinforcing the importance of preparedness and resilience.
The numbers illustrate the trend clearly. Since 2017, the average lightning claim has increased nearly 147 percent, rising from $10,781 to $26,616.
States Seeing Greatest Impact
Florida once again led the nation in lightning-related homeowners insurance claims, recording 5,167 claims in 2025. California and Texas also ranked among the highest number of claims.
Texas stood out for another reason. It generated the highest total insured losses, nearly $253 million, and the highest average claim severity among the leading states, with an average loss of $60,382 per claim.
More than half of all lightning-related homeowners claims originated from the nation’s top 10 states, underscoring how concentrated lightning risk remains in certain regions.
The increase in lightning-related losses is occurring against the backdrop of rising insured losses from severe convective storms (SCS), a category of weather events that includes thunderstorms, hail, tornadoes, straight-line winds and lightning.
While hurricanes often generate the largest individual catastrophes, severe convective storms occur far more frequently and affect communities across much of the country. In recent years, they have become one of the insurance industry’s most significant sources of property losses, causing billions of dollars in damage annually.
Lightning is one of the many ways severe thunderstorms can damage homes and businesses. A single storm can produce hail, damaging winds, flooding rainfall and lightning strikes, creating multiple pathways for property damage. As rebuilding and repair costs continue to rise, even relatively localized events can result in substantial insured losses.
The growing cost of lightning claims serves as another reminder that resilience and preparedness matter. Taking steps to strengthen homes, protect electrical systems, and reduce exposure to weather-related risks can help homeowners recover more quickly and may lessen the financial impact of future storms.
Lightning Damage Extends Beyond Direct Strikes
Many homeowners associate lightning damage with dramatic images of homes directly struck. In reality, some of the most common losses stem from secondary effects. Power surges created by nearby strikes can travel through electrical, cable and telephone lines, damaging expensive electronics, appliances, HVAC systems, and other household equipment. In some cases, the damage may not be immediately apparent.
Lightning damage, such as fire, is generally covered by standard homeowners, condo, renters, and business insurance policies. Some homeowners policies also provide coverage for power surges that result directly from a lightning strike.
The financial toll of lightning may be even greater than the claims data suggests. When lightning ignites a fire, the resulting insurance claim is often categorized as a fire loss – rather than a lightning loss – because most of the damage stems from the fire itself. As a result, some losses that originate with a lightning strike may not be reflected in lightning-specific claims statistics. In wildfire-prone regions, lightning can also serve as an ignition source for catastrophic fires, further expanding its economic impact.
California’s August 2020 lightning outbreak provides an important example of how lightning can contribute to losses that extend well beyond those captured in homeowners insurance claims. More than 12,000 lightning strikes over several days ignited hundreds of wildfires, many of which merged into large fire complexes. The fires burned millions of acres and destroyed thousands of structures, demonstrating how lightning-related events can generate impacts across entire regions.
The Lightning Protection Institute (LPI) notes that lightning strikes occur at an astonishing rate of approximately 100 times every second worldwide.
While most strikes never result in property damage, the frequency of lightning activity underscores the need for preparedness. Lightning can affect homes, businesses, and critical infrastructure, causing damage through direct strikes, fires and power surges.
The increase in lightning-related losses serves as a reminder that resilience investments made before a storm arrives can help reduce damage and speed recovery. Properly installed lightning protection and surge protection systems can significantly reduce risk and help protect people and property.
Lightning protection systems are designed to intercept a lightning strike and safely direct the electrical energy into the ground. A complete system typically includes air terminals (lightning rods), conductors, bonding components and grounding systems that work together to reduce the risk of fire, structural damage and electrical system failures. While no system can prevent lightning from occurring, properly designed and installed lightning protection systems can significantly reduce the potential for damage to homes, businesses and critical infrastructure.
Building Resilience Before the Next Storm
Lightning may be unavoidable, but many losses are preventable. Homeowners can reduce their exposure by:
Installing whole-home surge protection systems.
Using point-of-use surge protectors for sensitive electronics.
Having electrical systems inspected and maintained regularly.
Considering professionally installed lightning protection systems and whole-home surge protection in high-risk areas.
Creating home inventories to simplify insurance claims if damage occurs.
Reviewing insurance policies to understand coverage for lightning-related losses.
Resilience begins long before storm clouds appear. In addition to installing surge protection and maintaining electrical systems, homeowners can review their insurance coverage annually, document personal belongings through home inventories, trim trees and branches near structures, and develop family emergency plans.
These measures may not prevent lightning from striking, but they can reduce damage, speed recovery and help families return to normal more quickly after a loss. As weather-related risks continue to evolve, preparedness remains one of the most effective tools homeowners have to protect their property and financial security.
The latest lightning loss data shows that preparation is not just about safety. It is also about protecting families from potentially significant financial losses.
North Carolina has enacted a measure to ban third-party litigation funding, the first of its kind in the country amid nationwide efforts to rein in the practice.
Signed into law on Monday after near-unanimous support in the state legislature, the Prohibit Litigation Investments Act makes it “unlawful for a person to engage in litigation investment” or “to furnish litigation investment to a party or counsel of record in a civil proceeding” in the state. Exclusions to the law include contingency-fee arrangements, insurer indemnification or defense obligations, pro bono funding from nonprofit organizations, and other forms of financing not contingent on suit outcomes.
“For too long, dark money has supported the legal system abuse tactics of billboard attorneys, funding an excessive volume of lawsuits through largely undisclosed arrangements,” said Triple-I CEO Sean Kevelighan. “Greater transparency helps shine a light on these financial interests and addresses practices that can contribute to legal system abuse, drive up claim costs, and ultimately increase insurance premiums for consumers and businesses.”
TPLF occurs when outside investors profit from lawsuits by paying legal costs in exchange for a share of the settlement or judgment if the suit wins. In practice, this encourages prolonged and unnecessary cases and can culminate in extreme nuclear verdicts of $10 million or more. TPLF contributes to the $6,664 in added annual costs for the average American household through excess litigation.
States diverge on nonlawyer involvement
North Carolina’s new law is the latest in a wave of TPLF-related legislation building on a record number of bills introduced nationally last year to improve TPLF transparency. While many states have continued to focus on disclosure, some are targeting alternative business structures and nonlawyer-owned law firms as sources of undue courtroom friction.
Colorado, for instance, recently passed a law that prohibits legal fee or revenue sharing with outside investors and increases restrictions on ownership. Both it and a 2025 measure regulating foreign TPLF agreements were backed by a coalition that included the Colorado Trial Lawyers Association, a partnership the organization explained is aligned with their shared interest in upholding the integrity of the legal system.
Similar bills are moving through the California and Illinois state legislatures, each of which have also received support from several state bar associations. Triple-I expanded its legal system awareness campaign in both states earlier this year to help demonstrate the link between their insurance affordability struggles and legal system abuse.
Emerging challenges to nonlawyer ownership and investments contrast from regulatory changes in recent years that expanded these practices in some states. In 2020, Utah launched the nation’s first regulatory “sandbox” permitting nontraditional legal service providers who operate under the supervision of the state supreme court, including firms invested in and/or owned by nonlawyers. That same year, Arizona repealed its rule barring nonlawyer fee sharing and ownership, later unveiling its own program in 2021 to facilitate alternative business structure arrangements.
As policymakers seek ways to protect consumers from rising costs, it’s important to learn from states that are succeeding. Florida has a long history of problems caused by insurance fraud and litigation abuse that contributed to upward pressure on insurance rates. Recent reforms to check these practices have made the Sunshine State a national model for the kinds of market improvements states can expect through tort legislation.
By limiting third-party investor influence in litigation, North Carolina and Colorado may soon serve as additional blueprints to address the root causes of rising costs, rather than merely treating the symptoms.
By Jeff Dunsavage, Head of Research Publications and Insights, Triple-I
Oklahoma homeowners insurance premiums are escalating due to a range of factors. A new Triple-I Policy Brief discusses the drivers of this trend and cautions state legislators to make sure any attempts to contain these rising costs target its underlying causes.
“Because insurance is integral to the total cost of homeownership, lawmakers often find themselves under pressure from constituents to rein in premiums,” the brief says. “Unfortunately, their efforts often lead to policies that would hurt consumers, rather than help them. It is important for policymakers to understand the causes of premium increases and to let that understanding inform decision making.”
Oklahoma is among the least affordable states for home insurance coverage (ranked 48th, with 3.45% of household income spent), according to data from the Insurance Research Council (IRC). IRC, like Triple-I, is an affiliate of The Institutes.
Rising costs of materials and labor to repair and replace damaged or lost property have been major drivers of increasing premium rates. Legal system abuse and claims fraud also play a substantial role in rising rates nationally. Roof replacement fraud is a rapidly worsening problem nationally, according to the National Insurance Crime Bureau (NICB), and the Oklahoma attorney general’s office has called roofing scams “the most common complaint submitted by consumers.”
Following particularly severe weather in April, the attorney general warned Oklahomans to be vigilant of contractor fraud.
“In the aftermath of severe weather, scammers often target vulnerable homeowners trying to recover and rebuild,” said Attorney General Gentner Drummond. “While it is natural to want to make repairs quickly, taking the time to choose a reputable contractor is critical to protecting your home and finances.”
While it may be politically tempting to address a state’s affordability issues by imposing more regulatory constraints on insurers Triple-I warns that states that have tried such approaches have shown they are neither effective nor sustainable.
For Oklahoma, addressing the severity of weather-related claims is key to moderating rate increases. Risk management programs like Strengthen Oklahoma Homes – which provides grants to Oklahoma residents for residential wind and hail mitigation on new and existing, owner-occupied, primary residence single-family homes – is a great start. Modeling the success of the Strengthen Alabama Homes initiative, funding for Oklahoma’s program comes from the insurance industry and is not funded by the state’s general budget.
“The property/casualty insurance industry is an essential partner in addressing states’ affordability crises,” the Triple-I brief says. “States that work with the industry can expect more effective, more sustainable results than those that only attack the symptoms instead of the underlying cost drivers.”
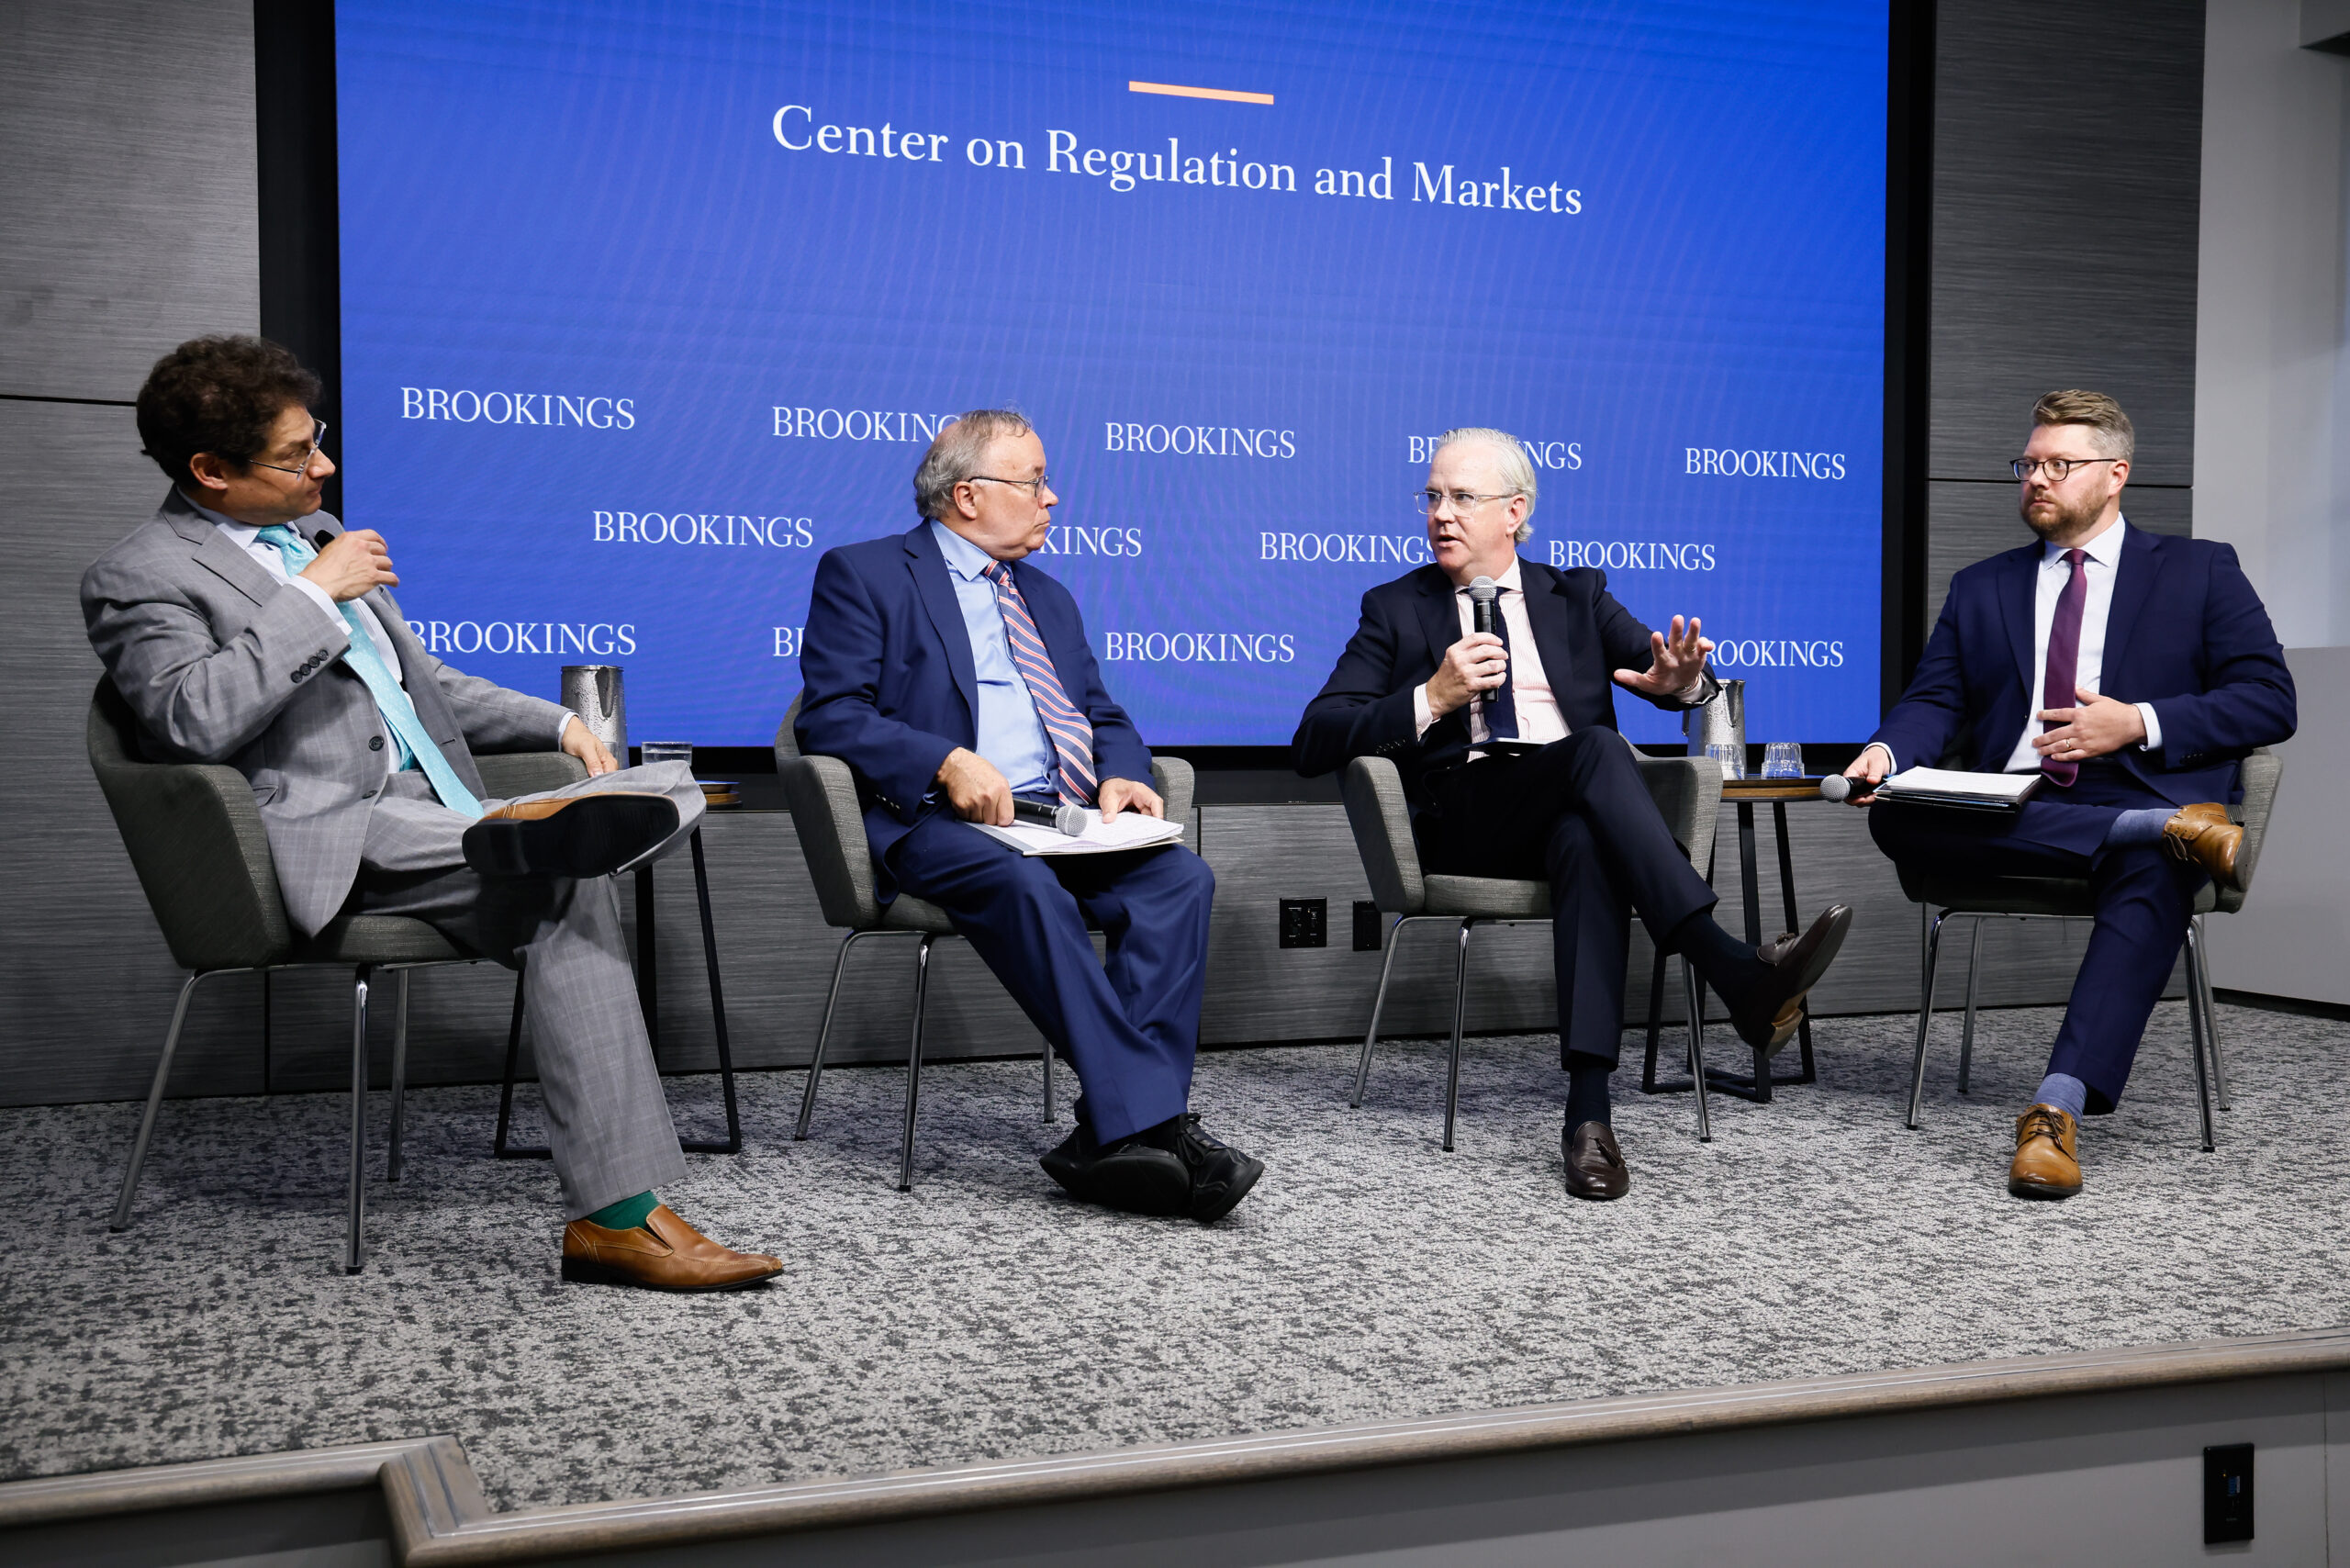
Personal auto insurance premiums represent multiple aspects of the affordability crisis U.S. consumers face today, and a panel discussion at the Brookings Center on Regulation and Markets this week helped define and clarify them.
Panel moderator Aaron Klein, Miriam K. Carliner Chair and senior fellow in Economic Studies at the Brookings Institution, began the discussion by acknowledging “the rising rates of car insurance are part of the broader set of topics that have been given the term ‘affordability.’”
Representing insurers, regulators, and consumers, the panelists included Sean Kevelighan, CEO of Triple-I; Justin Zimmerman, a former commissioner in New Jersey’s Department of Banking and Insurance; and Chuck Bell, programs director for advocacy at Consumer Reports.
All agreed that much of the blame for rising rates can be attributed to external factors such as the costs associated with safer, more technologically sophisticated vehicles, thereby raising the costs to repair and replace them. Inflation has exacerbated these impacts, with auto replacement costs up 28 percent from 2021 to 2025. Over the past 12 months, inflation increased 4.2 percent, thanks in large part to geopolitical risks, supply-chain disruptions, and rising oil prices.
Disagreement surfaced, however, around the degree of insurance-industry responsibility for insurance costs. Consumer Reports’ Chuck Bell suggested the $14 billion insurers issued in rebates to consumers during the COVID-19 pandemic was insufficient, prompting Kevelighan to point out that, “of all the refunds being given, you saw the most coming out of the insurance business and community.” Zimmerman noted that many states also froze insurers’ ability to raise rates during the pandemic, leading to some post-pandemic “rate catch-up.”
Rampant legal system abuse helps fuel the strain. While derided as a concept by some, Kevelighan cited analysis from Triple-I and the Casualty Actuarial Society that indicates excessive litigation added up to $281.2 billion in increased liability insurance losses from 2015 to 2024 – a finding that economic inflation alone cannot explain. A separate Triple-I report on civil case filings indicated roughly one-third of increasing inflation in auto liability losses stemmed from these legal trends.
Kevelighan also highlighted the $380 million spent by third-party litigation funders (TPLF) on online advertising last year, according to a study from the National Insurance Crime Bureau and 4WARN. Now “a global multi-billion-dollar asset class,” TPLF has become a target for reform in a growing number of states, notably New York.
New York affordability struggles
Wiping out billions of dollars in U.S. economic activity annually, legal system abuse costs New York residents 427,794 jobs and $7,027 per household per year, contributing to the fourth-highest auto insurance expenditures in the nation, Triple-I estimates. Moreover, the state’s average personal auto injury claim is $46,726, at more than twice the national average.
Building on legislation to tackle TPLF, New York lawmakers recently passed a package of auto insurance reform bills to disincentivize legal system abuse and fraud, one of which will introduce a $100,000 cap on noneconomic damages for drivers who were at fault, uninsured, or impaired at the time of an accident. Comparative negligence rules were also updated to ensure costs cannot be shifted away from the motorists responsible for an accident.
Kaitlin Asrow, New York State’s acting superintendent for the Department of Financial Services, told Klein in an interview before the panel, “Over the last five years, suspicious fraud reports for just no-fault auto increased 80 percent.” She added that “staged accidents were up 34 percent” in New York City alone during the same period.
While further reforms are needed to address the Empire State’s high insurance costs, Kevelighan pointed out that similar efforts in Florida have begun to drive substantial premium reductions and renewed private market competition.
Modifying behavior for risk reduction
Though many influences on insurance costs are structural, Kevelighan emphasized “a lot of this comes down to our behaviors and how we’re driving and living.” As such, insurance must shift from “a once or twice a year type of transaction” to “an open and ongoing conversation” between insurers and their customers.
Part of that conversation revolves around distracted driving, which jumped significantly after the onset of the COVID-19 pandemic and remains at elevated levels. As measured by a recent Nationwide survey, seven in ten commercial drivers have reported experiencing increased distraction as well as reckless driving from other drivers, at a 10-point increase from 2025.
Nationwide also found that commercial auto loss ratios drop by at least 30 percent when policyholders use telematics, a technology that monitors mileage, braking and acceleration, and other driving patterns to provide real-time feedback that can adjust unsafe behavior. In addition, built-in accident-avoidance systems are reducing rear-end collisions by 40 to 50 percent.
Noting telematics research is still in its early stages, Kevelighan said the “interaction and exchange” of risk information between insurers and policyholders “is where the industry is going to start shifting from just detecting and repairing after a catastrophe to predicting and preventing.”
“We’ve got to make sure we’re balancing out what it is that we’re doing to reduce our risk, because that’s the real driver,” Kevelighan explained. “When we reduce the risk, we can reduce the cost.”
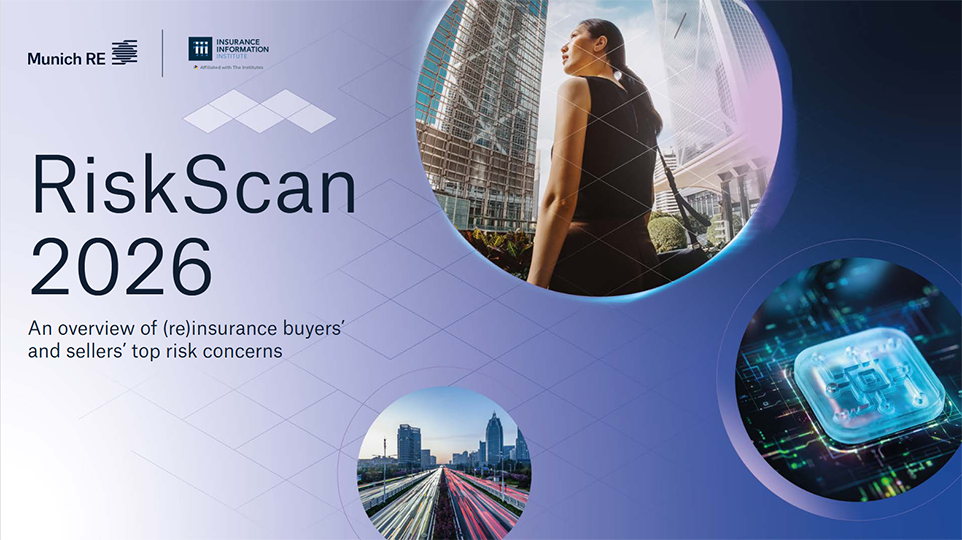
Organizations across the insurance value chain are navigating an increasingly complex risk landscape, demanding more integrated approaches to resilience shared among all segments of the property/casualty (P/C) market, according to RiskScan 2026, a new research study from Munich Re US and Triple-I.
Based on survey data from more than 1,700 participants in the United States and United Kingdom, RiskScan 2026 explores risk perceptions and exposures across five key market segments:
P/C insurance carriers,
P/C agents and brokers,
Middle-market decision makers,
Small-business owners, and
consumers.
Comprising two in-depth reports, the study builds on the previous RiskScan 2024 and features a new report highlighting global specialty market perspectives and insights.
Across all audiences, cyber incidents, economic pressures, and AI emerged as chief concerns, indicating insurers and their customers are largely aligned on risks reshaping the market. Increasing frequency and severity of natural catastrophes also ranked high, particularly for perils traditionally associated with less catastrophic loss, such as wildfires, flooding, and severe convective storms.
“The real challenge – and opportunity – is in understanding how these forces intersect,” said Sabrina Hart, president and CEO of Munich Re Specialty North America. “A cyber event can trigger operational disruption, a climate event can cascade through supply chains, and legal inflation can magnify losses well beyond the initial event.”
Growing consumer awareness
While knowledge gaps remain, policyholders are becoming more aware of these connections. Consumers and businesses who participated in the 2024 survey, for instance, primarily did not identify legal system abuse as an insurance cost driver – a trend middle-market decision makers and small business owners reversed in the updated study.
Such responses suggest industry stakeholders increasingly recognize the long-term impacts of risks, rather than focus on the short-term disruptions of individual events. Economic conditions play a leading role in this shift as “a multiplier of insurance risk, affecting affordability, claims severity, capital allocation, and long-term market stability across the insurance value chain,” explained Michel Léonard, Triple-I’s chief economist and data scientist.
Flood and cyber take-up still low
Despite growing awareness, consumers continued to express less concern about flood than insurance professionals and businesses, in part reflecting misconceptions about flood risk and policy exclusions and limitations. Many consumers as well as small business owners are unaware that homeowners’ and commercial property insurance do not typically cover flood damage. Consumers may also believe flood coverage is unnecessary unless their mortgage lenders require it or drop their flood insurance coverage once their mortgage is paid off to save money.
Similarly, though all market segments considered cyber incidents a significant concern, the report notes that cyber take-up rates in the small commercial and personal line spaces remain low. Misunderstandings surrounding cyber risk coverage options and benefits help fuel this discrepancy, revealing a gap between insurer perceptions of product value and that of their customers.
“The protection gaps highlighted in this research underscore the urgent need to better educate consumers and businesses,” said Triple-I CEO Sean Kevelighan. “As flood, cyber, and other interconnected exposures continue to evolve, the industry has an important opportunity to strengthen public understanding, close protection gaps, and work collaboratively with consumers, policymakers, businesses, and communities to better predict, prepare, and prevent ever increasing risks.”