Several metrics that influence auto insurance premium rates are starting to improve, but it will take time for these improvements to be reflected in flattening rates, according to a recent Triple-I Issues Brief.
Direct premiums written and underwriting profitability improved dramatically in 2023. Additionally, 2023 net written premium growth of 14.3 percent is the highest in over 15 years. These are great gains, but it’s important to remember that they come on top of results in 2022 that were the worst in recent years.
The number of drivers on the road and miles driven have returned to pre-pandemic levels – but the risky driving behaviors that led to high losses during the pandemic have not improved. More accidents with severe injuries and fatalities have driven up claims and losses in terms of both vehicle damage and liability, while attracting greater attorney involvement and legal system abuse. Compounding these conditions has been historically high inflation, which puts upward pressure on the material and labor costs, increasing the cost of claims.
Telematics technologies, which allow insurers to analyze risk profiles and tailor rates based on individual driving habits, offer the possibility of some relief. By providing feedback that can influence driving behavior, telematics has been shown to lower risk and help reduce the cost of insurance. An Insurance Research Council survey found 45 percent of drivers said they made significant safety-related changes in how they drove after participating in a telematics program. Another 35 percent said they made small changes.
But broader risk and economic factors are likely to keep premium rates high in most cases for the foreseeable future.
Strong improvements in personal auto insurance results helped drive the U.S. property and casualty insurance industry to its second-highest net underwriting gain in any quarter since at least 2000, according to an S&P Global Market Intelligence analysis.
Just 12 months from its worst-on-record start to a calendar year – with a combined ratio of 102.2 – the industry generated a ratio of approximately 94.0. Combined ratio is a measure of underwriting profitability in which a ratio under 100 indicates a profit and one above 100 represents a loss.
While quarterly statutory data is insufficient to calculate combined ratios at the line-of-business level, S&P previously estimated that a direct incurred loss ratio of approximately 71.3 percent in the personal auto sector would have produced break-even underwriting results in the first quarter.
“Applying the same methodology to the first-quarter result of 66.7% yields an estimated combined ratio of 95.6,” S&P said. The industry’s full-year 2023 private auto combined ratio was 104.9.
On a consolidated basis across business lines, incurred losses increased only modestly, while net premiums earned continued to rise rapidly. This reflects the combination of continued top-line strength in many commercial lines of business and what S&P called “the hardest private auto pricing environment in 47 years.”
The industry also benefited from relatively mild catastrophe activity compared with the comparable prior-year period.
While these strong first-quarter results are noteworthy, it will take time to know whether they represent the start of a trend. Multiple severe convective storm events already have occurred in the second quarter, and the 2024 Atlantic hurricane season is forecast to be “extremely active.”
Personal auto’s recent improvements follow 2022 results that were among the worst in recent years. The number of drivers on the road has returned to pre-pandemic levels, and the risky driving behavior that led to high losses during the pandemic has not improved. More accidents with severe injuries and fatalities have driven up claims and losses in terms of both vehicle damage and liability, attracting greater attorney involvement and legal system abuse.
Compounding these loss drivers has been historically high inflation, which puts upward pressure on the material and labor costs for both the auto and property lines.
Favorable first-quarter results are good news, but it’s important for policyholders and policymakers to remember that the current hard market wasn’t created overnight. It will take time for insurers’ performance and drivers’ rates to stabilize.
Nearly 16 percent (15.7) of U.S. drivers in 2022 had auto liability insurance limits that were too low to pay for damages or injuries they caused, according to new research from the Insurance Research Council (IRC), a division of The Institutes.
The IRC report found that the underinsured motorist (UIM) rate increased from 12.6 percent in 2017, to a peak in 2020 at 16 percent, and remained elevated in 2021 and 2022. The 2022 rates, however, varied widely across the country, from 5.6 percent in the District of Columbia to 40.9 percent in Colorado. Other states with high UIM rates in 2022 included Nevada (39.4 percent), Georgia (37.3 percent), Louisiana (35.6 percent), and Kentucky (32.0 percent).
The IRC estimates are based on UIM and bodily injury (BI) liability exposure and claim count data collected from 10 major insurers representing approximately half of the U.S. private passenger auto insurance market. The ratio of UIM-to-BI claim frequencies yields a reasonable estimate of the proportion of injury-producing accidents in which the accident victim’s expenses exceeded the at-fault driver’s liability limits.
Auto insurers offer two types of coverage to protect policyholders: uninsured motorists (UM) coverage, which compensates accident victims for injuries or damage caused by a driver without liability insurance or from a hit-and-run driver; and underinsured motorists (UIM), which compensates the injured party for costs associated with injuries or property damage that exceed the at-fault driver’s liability coverage.
Once it is determined that the at-fault driver’s insurance will not fully cover damages, the accident victim files a claim with their own insurance company under their UM/UIM coverage.
“At the start of the pandemic, UIM frequency dropped as the shutdowns dramatically curtailed driving,” said Dale Porfilio, FCAS, MAAA, president of the IRC. “However, UIM frequency dropped less than BI. But by 2022, UIM claim frequency had returned to its 2019 level while BI claim frequency was still below pre-pandemic levels.”
Porfilio, who is also chief insurance officer for Triple-I, noted that, in today’s litigious society, having state minimum levels on uninsured motorist and underinsured motorist insurance does not provide adequate financial protection.
“Riskier behaviors like speeding and distracted driving, in combination with legal system abuse and economic inflation, all contribute to elevated UIM rates,” Porfilio added.
Auto premiums continue to increase as rising labor and material prices, alongside natural disasters, are forcing insurers to contend with significant losses.
As Triple-I previously found in its January report, Insurance Economics and Underwriting Projections: A Forward View, “commercial auto underwriting losses continue, with a projected 2023 net combined ratio of 110.2, the highest since 2017,” according to Jason B. Kurtz, FCAS, MAAA, a Principal and Consulting Actuary at Milliman. Combined ratio is a standard measure of underwriting profitability, in which a result below 100 represents a profit and one above 100 represents a loss.
Insurers are now having to increase rates in response to losses that are expected to keep rising.
“Nobody wants to have that higher-price bill,” said Sean Kevelighan, Triple-I’s CEO. However, he added companies “need to price insurance according to the risk level that’s out there.”
While inflation is partially to blame for these increases, natural disasters are also contributing to rising costs—and not only in traditionally disaster-prone areas like Florida and California.
As the overall P&C industry has struggled with severe convective storms, hurricanes, and other natural disasters, these losses have also been felt in commercial auto. In fact, 2023 witnessed around two dozen U.S. storms, each with losses of around a billion dollars or more. This included major lightning, hail, and damaging winds around many areas of the of the U.S.
“While a lot of these storms don’t make national headlines, they do tend to be very costly at the local level,” says Tim Zawacki, principal research analyst for insurance at S&P Global Market Intelligence. “And the breadth of where these storms are occurring is something that I think the industry is quite concerned about.”
While disasters and economic inflation continue to roil commercial auto, so too does social inflation. As the Triple-I previously reported, “social inflation,” which is the presence of inflation in excess of economic inflation, has also significantly contributed to increases in commercial auto premiums.
Triple-I found that “from 2013 to 2022, increasing inflation drove losses up by between $35 billion and $44 billion, or between 19 percent and 24 percent. The pandemic brought significant change to commercial auto liability, decreasing claim frequency while increasing claim severity more dramatically.”
This increased claim severity is at least partially due to changing driving patterns since the pandemic, including distracted driving, which involves behaviors like cellphone use while behind the wheel. A Triple-I Issues Brief, Distracted Driving: State of the Risk, enumerated these concerns, which have undoubtedly played a role in rising commercial auto premiums.
Indeed, a confluence of issues are playing into rising auto premiums. While natural disasters are out of the control of insurance providers and their policyholders, other factors must be addressed to steady the cost of this line of insurance. This includes telematics and usage-based insurance, which has gained more acceptance since the pandemic.
Still, it is incumbent on insurers, policyholders, and policymakers to create a more sustainable market for auto insurance, working together to tackle the challenges of both climate risk and dangerous driving behavior.
Even as California moves to address regulatory obstacles to fair, actuarially sound insurance underwriting and pricing, the state’s risk profile continues to evolve in ways that underscore the importance of risk-based insurance pricing and investment in mitigation and resilience.
Triple-I’s latest “State of the Risk” Issues Brief discusses this changing risk environment and the impact of Proposition 103 – a three-decades-old measure that has made it hard for insurers to profitably write coverage in the state. In a dynamically evolving risk environment that includes earthquakes, drought, wildfire, landslides, and — in recent years, due to “atmospheric rivers” — damaging floods, Proposition 103 has prevented insurers from using the most current data and advanced modeling technologies. Instead, it has required them to price coverage based on historical data alone.
It also has restricted accurate underwriting and pricing by not allowing insurers to incorporate the cost of reinsurance into their pricing. Insurers use reinsurance to maximize their capacity to write coverage, and reinsurance rates have been rising for many of the same reasons as primary insurance rates. If insurers can’t reflect reinsurance costs in their pricing – particularly in catastrophe-prone areas – they must pay for these costs from policyholder surplus, reduce their market share in the state, or do both.
Proposition 103 also has impeded premium rate changes by allowing consumer advocacy groups to intervene in the rate-approval process. This makes it hard to respond quickly to changing market conditions, resulting in approval delays and rates that don’t accurately reflect current (let alone future) risk. It also drives up legal and administrative costs.
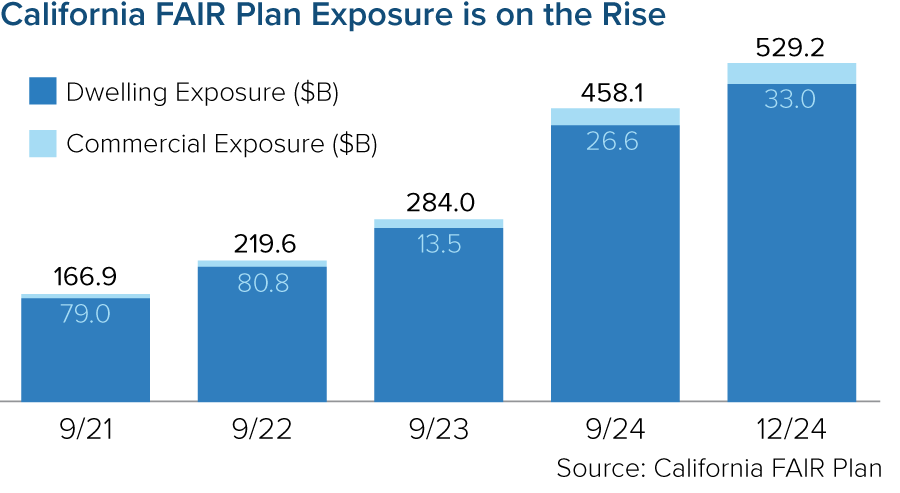
This has led, in some cases, to insurers deciding to limit or reduce their business in the state. With fewer private insurance options available, more Californians are resorting to the state’s FAIR Plan, which offers less coverage for a higher premium.
This isn’t a tenable situation.
In September 2023, California Insurance Commissioner Ricardo Lara announced a Sustainable Insurance Strategy for the state that includes allowing insurers to use forward-looking risk models that prioritize wildfire safety and mitigation and include reinsurance costs into their premium pricing. In exchange, insurers must cover homeowners in wildfire-prone parts of the state at 85 percent of their statewide coverage.
Issues around property insurance affordability are not confined to California. They’ve been a long time in the making, and they won’t be resolved overnight.
“Any sustainable solutions will have to rest on actuarially sound underwriting and pricing principles,” the Triple-I brief says. “Unfortunately, too often, the public discourse frames the risk crisis as an `insurance crisis’ – conflating cause with effect. Legislators, spurred by calls from their constituents for lower insurance premiums, often propose measures that would tend to worsen the problem because these proposals generally fail to reflect the importance of accurately valuing risk when pricing coverage.”
California’s Proposition 103 and the federal flood insurance program prior to its Risk Rating 2.0 reforms are just two examples, according to Triple-I.
Two bills proposed in Illinois this year illustrate yet again the need for lawmakers to better understand how insurance works. Illinois HB 4767 and HB 4611 – like their 2023 predecessor, HB 2203 – would harm the very policyholders the measures aim to help by driving up the cost for insurers to write personal auto coverage in the state.
“These bills, while intended to address rising insurance costs, would have the opposite impact and likely harm consumers by reducing competition and increasing costs for Illinois drivers,” said a press release issued by the American Property Casualty Insurance Association, the Illinois Insurance Association, and the National Association of Mutual Insurance Companies. “Insurance rates are first and foremost a function of claims and their costs. Rather than working to help make roadways safer and reduce costs, these bills seek to change the state’s insurance rating law and prohibit the use of factors that are highly predictive of the risk of a future loss.”
The proposed laws would bar insurers from considering nondriving factors that are demonstrably predictive of claims when setting premium rates.
“Prohibiting highly accurate rating factors…disconnects price from the risk of future loss, which necessarily means high-risk drivers will pay less and lower-risk drivers will pay more than they otherwise would pay,” the release says. “Additionally, changing the rating law and factors used will not change the economics or crash statistics that are the primary drivers of the cost of insurance in the state.”
Triple-I agrees with the key concerns raised by the other trade organizations. As we have written previously, such legislation suggests a lack of understanding about risk-based pricing that is not isolated to Illinois legislators – indeed, similar proposals are submitted from time to time at state and federal levels.
What is risk-based pricing?
Simply put, risk-based pricing means offering different prices for the same level of coverage, based on risk factors specific to the insured person or property. If policies were not priced this way – if insurers had to come up with a one-size-fits-all price for auto coverage that didn’t consider vehicle type and use, where and how much the car will be driven, and so forth – lower-risk drivers would subsidize riskier ones. Risk-based pricing allows insurers to offer the lowest possible premiums to policyholders with the most favorable risk factors. Charging higher premiums to insure higher-risk policyholders enables insurers to underwrite a wider range of coverages, thus improving both availability and affordability of insurance.
This simple concept becomes complicated when actuarially sound rating factors intersect with other attributes in ways that can be perceived as unfairly discriminatory. For example, concerns have been raised about the use of credit-based insurance scores, geography, home ownership, and motor vehicle records in setting home and car insurance premium rates. Critics say this can lead to “proxy discrimination,” with people of color in urban neighborhoods sometimes charged more than their suburban neighbors for the same coverage.
The confusion is understandable, given the complex models used to assess and price risk and the socioeconomic dynamics involved. To navigate this complexity, insurers hire teams of actuaries and data scientists to quantify and differentiate among a range of risk variables while avoiding unfair discrimination.
While it may be hard for policyholders to believe factors like age, gender, and credit score have anything to do with their likelihood of filing claims, the charts below demonstrate clear correlations.
Policyholders have reasonable concerns about rising premium rates. It’s important for them and their legislators to understand that the current high-rate environment has nothing to do with the application of actuarially sound rating factors and everything to do with increasing insurer losses associated with higher frequency and severity of claims. Frequency and claims trends are driven by a wide range of causes – such as riskier driving behavior and legal system abuse – that warrant the attention of policymakers. Legislators would do well to explore ways to reduce risks, contain fraud other forms of legal system abuse, and improve resilience, rather than pursuing “solutions” to restrict pricing that will only make these problem worse.
The increasing frequency and severity of claims costs beyond insurer expectations continue to threaten insurance coverage and affordability. Triple-I’s latest Issue Brief, Legal System Abuse – State of the Risk describes how trends in claims litigation can drive social inflation, leading to higher insurance premiums for policyholders and losses for insurers.
Key Takeaways
Insured losses continue to exceed expectations and surpass inflation, notably impacting coverage affordability and availability in Florida and Louisiana.
In promoting the term “legal system abuse”, Triple-I seeks to capture how litigation and related systemic trends amplify social inflation.
Progress has been made toward increased awareness about the risks of third-party litigation funding (TPLF), but more work is needed.
What we mean when we talk about legal system abuse
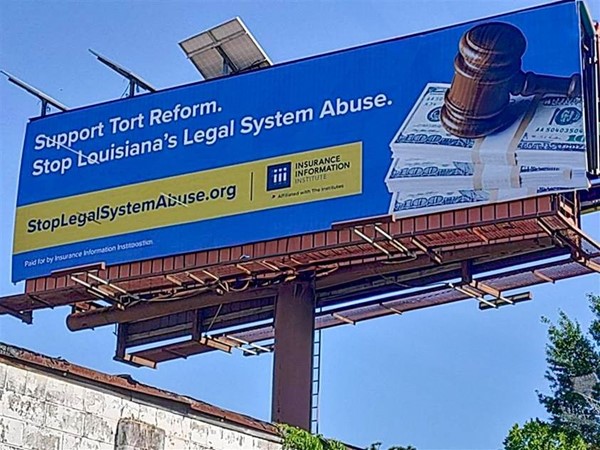
Legal system abuse occurs when policyholders, plaintiff attorneys, or other third parties use fraudulent or unnecessary tactics in pursuing an insurance claim payout, increasing the time and cost of settling insurance claims. These actions can include illegal maneuvers, such as claims inflation and frivolous or outright fraudulent claims. Unscrupulous contractors, for example, seek to profit from Assignment of Benefits (AOBs) by overstating repair costs and then filing lawsuits against the insurer – sometimes even without the homeowner’s knowledge. Filing a lawsuit to reap an outsized payout when it’s evident the claims process will likely provide a fair, reasonable, and timely claim settlement can also be considered legal system abuse.
The latest brief provides a round-up of several studies Triple-I and other organizations conducted on elements of these litigation trends. The report, “Impact of Increasing Inflation on Personal and Commercial Auto Liability Insurance,” describes the $96 billion to $105 billion increase in combined claim payouts for U.S. personal and commercial auto insurer liability. The Insurance Research Council highlighted the dire lack of affordability for personal auto and homeowners insurance coverage in Louisiana, along with the state’s exceptionally high claim litigation rates.
Readers will also find an update on the discussion of legal industry trends associated with increased claims litigation. The lack of transparency around TPLF arrangements and the fear of outside influence on cases are attracting the attention of legislators at the state and federal levels. The brief also describes how some law firms may use TPLF resources to encourage large windfall-seeking lawsuits instead of speedy and fair claims litigation. Research findings suggest that consumers have become aware of how ubiquitous attorney ads can influence the frequency of lawsuits, increasing claims costs.
Florida: a case study in the consequences of excessive litigation
While several states, such as California, Colorado, and Louisiana, are experiencing a drastic rise in the cost of homeowners’ insurance, this brief discusses Florida. Property insurance premiums there rank the highest in the nation. Several insurers facing insurmountable losses have stopped writing new policies or left the state in the last few years. In some areas, residents are leaving, too, because of skyrocketing premiums.
Excessive claims litigation isn’t a new issue for insurers, but it can work with other elements to shift loss ratios and disrupt forecasts, rendering cost management more challenging. In Florida, factors such as the rise in home values and frequency of extreme weather events play a significant role, along with the challenges homeowners face in the aftermath: soaring construction costs, supply chain bottlenecks, and new building codes. However, Florida also leads the nation in litigating property claims. While 15 percent of all homeowners claims in the nation originate in the state, Floridians file 71 percent of homeowners insurance lawsuits.
In Florida and elsewhere, increasing time to settle a claim puts a financial strain on insurers, which is passed on to policyholders in the form of higher premiums. Legal system abuse activities are difficult (if not impossible) to forecast and mitigate, hampering insurers’ ability to remain in the market. Therefore, legal system abuse could be one of the biggest underlying drivers of social inflation. Without preventive measures, such as policy intervention and increased policyholder awareness, coverage affordability and availability is at risk.
Triple-I remains committed to advancing the conversation and exploring actionable strategies with all stakeholders. Learn more about legal system abuse and its components, such as third-party litigation funding by following our blog and checking out our social inflation knowledge hub.
Distracted driving—which has significantly increased since the coronavirus pandemic—is most significantly affected by cellphone use, according to a new Issues Brief by Triple-I.
The report, Distracted Driving: State of the Risk, states that cellphone use–which includes dialing, texting, and browsing–was among the most ubiquitous and highest-risk behaviors found in governmental and private sector studies. According to a 2022 national observational survey from the National Highway Traffic Safety Administration (NHTSA), a total of 2.5 percent of drivers stopped at intersections were talking on hand-held phones at any moment during the day in 2021.
The brief also found that the U.S. personal auto insurance industry’s combined ratio—a measure that represents underwriting profitability—increased dramatically from 2022, to 112.2. A combined ratio below 100 indicates an underwriting profit, while one above 100 indicates an underwriting loss.
“As drivers returned to the roads following the pandemic, distracted driving surged, causing higher rates of accidents, injuries, and deaths. This high-risk behavior has worsened in the years since, having huge implications for the insurance industry and their policyholders,” stated Dale Porfilio, chief insurance officer, Triple-I.
The report notes that telematics and usage-based insurance can potentially help insurers—and their policyholders—better understand a driver’s risk profile and tailor auto insurance rates based on individual driving habits.
Indeed, according to an Insurance Research Council survey in 2022, 45 percent of drivers said they made significant safety-related changes in how they drove after participating in a telematics program. An additional 35 percent stated that they made small changes in their driving behavior. Policyholders became more comfortable with having their insurer monitor their driving behavior when it resulted in potentially lower insurance costs during the onset of the pandemic.
“If telematics can influence drivers to change behaviors and reduce the number of accidents, the nation’s roadways will be safer and auto insurance can be more affordable,” Porfilio concluded.
According to a recent Chubb survey of 800 high-net-worth individuals in the United States and Canada, 92 percent are concerned about the size of a verdict against them if they were a defendant in a liability case – yet only 36 percent have excess liability insurance.
When it comes to liability, Chubb says respondents are most worried about auto accidents, allegations of assault or harassment, and someone working in their home getting hurt. Damage awards are rising dramatically for a number of reasons, according to Laila Brabander, head of North American personal lines claims for Chubb.
“Economic damages historically were based on factors such as the extent of an injury and resultant medical expenses or past and future loss of income,” she said. “But we are seeing a rise in non-economic damages, such as pain and suffering and post-traumatic stress disorder, that overshadow actual economic losses.”
Brabander described a case in which a client at a yoga studio fell onto the person next to her and was sued by the injured party for pain and suffering.
“The same plaintiffs’ tactics to encourage large verdicts in commercial trucking, auto liability, product liability and medical malpractice suits are now being utilized to push for larger jury awards against our high-net-worth clients,” Brabander said.
Another factor driving up the cost of settlements is the third-party litigation funding, in which firms provide funding to plaintiffs and their lawyers in exchange for a percentage of the settlement. These private-equity firms began in the commercial space and are now funding lawsuits against individuals and their insurers.
High-net-worth people also are deeply concerned about the threats posed to their homes by extreme weather and climate-related events. Much of this concern may be due to increased development in coastal areas vulnerable to tropical storms and flooding and in the wildland-urban interface – areas in which development places property into proximity with fire-prone wilderness (see links below).
Chubb’s findings are based on a survey of 800 wealthy individuals in the United States (650 respondents) and Canada (150 respondents). Respondents had investable assets of at least $500,000, with the majority reporting assets of $1.5 million to $50 million and 12 percent reporting assets of more than $50 million.
Louisiana continues to be the least affordable state for personal auto and homeowners insurance, according to a new report by the Insurance Research Council (IRC).
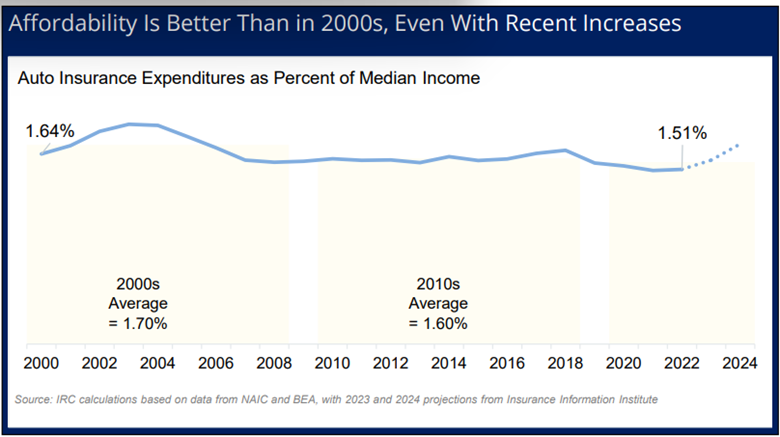
The average annual expenditure for auto insurance in Louisiana was $1,495 In 2020, more than 40 percent above the national average, the report finds. These costs account for 2.93 percent of the median household income in the state, rendering it the least affordable.
Louisianans also pay significantly more for homeowners coverage compared to the national average, with an average annual expenditure of $1,965. These are among the highest rates in the country, representing 3.84 percent of the median household income in the state – 55 percent above the national average.
“The state has faced multiple major weather events, with extensive litigation following each natural disaster,” the report finds. “Rising auto-repair and construction costs, as well as the state’s relatively low household income, have compounded these issues.”
Personal auto cost drivers include:
Accident frequency: The number of property damage liability claims per 100 insured vehicles in Louisiana is 16 percent higher than the countrywide average.
Injury claim relative frequency: Louisianians show a greater propensity to file injury claims once an accident has occurred, with a relative claim frequency almost twice the national average.
Medical utilization: Louisiana auto claimants are more likely than those in other states to receive diagnostic procedures, such as magnetic resonance imaging (MRI).
Attorney involvement: Louisiana claimants are more likely than those in other states to hire attorneys. Attorney involvement has been associated with higher claim costs and longer settlement times.
Claim litigation: The rate of litigation in personal auto claims in Louisiana is more than twice the national average. This rate is the second-highest in the country, surpassed only by Florida.
Homeowners cost drivers include:
Claim frequency, catastrophe claims: The number of catastrophe claims paid for every 100 homes insured for the entire year in Louisiana is almost six times higher than the national average.
Claim severity, catastrophe claims: In the hurricane-prone region, Louisianians are second only to Floridians in the amount paid for the average homeowners insurance claim. Louisiana is 12 percent higher than the national average.
Natural-hazard risk, weather: Louisiana’s exposure to building damage from weather hazards is second only to Florida’s and is dramatically higher than other states.
Claim litigation: Claims in Louisiana were 12 times more likely to involve litigation, compared with states other than Florida.
These issues have led to the insolvency of several carriers and the departure of key insurance providers from the market. Many remaining insurers have chosen to limit coverage and raise premiums.
Louisiana has tried to address these coverage gaps through incentive programs for private carriers and a greater reliance on the state-run insurer Louisiana Citizens Property Insurance Corporation, the last-resort insurance. However, Louisiana Citizens Property Insurance Corporation can be expensive, making it unaffordable for many and especially for the state’s most vulnerable residents.
These hardships have also influenced a population decline in Louisiana, as individuals and businesses are uprooting and seeking improved affordability elsewhere. Louisiana’s population declined by almost 1 percent in 2022, accounting for nearly 39,000 people, according to a new Census estimate.