All posts by Jeff Dunsavage

Assess, Measure, Mitigate Your Lightning Risk

By Kelley Collins, Director of Business Development and Communications, Lightning Protection Institute

Our lives are filled with risk assessment and mitigation. From grabbing an umbrella for a rainy day to stocking up on supplies for an impending natural disaster, we assess and measure the potential risks before an event occurs to be prepared and protect ourselves from unwanted consequences.

For many, however, assessing and mitigating lighting risk isn’t necessarily top of mind. We know lightning is going to strike – more than 31 million cloud-to-ground strikes occur annually. But being personally affected seems so unlikely that people may think preparation isn’t necessary or even possible. Understanding how to mitigate risks associated with lightning is essential to individuals and property owners.

Lightning strikes about 100 times every second. Incorporate assessment of lightning risk into our daily lives.

Impact of Lightning: Homes, Businesses, Critical Facilities

About 6,000 times a minute, there is a lightning strike that contains an electrical discharge hotter than the sun. One strike can cause immense damage that goes beyond fire. The damage to the electrical infrastructure and the electronics connected to that infrastructure can be destroyed – bringing communication, security and productivity to a halt. 

Convective storms – which are associated with thunder, lightning, and other weather changes – caused $38 billion in insured losses in the first half of 2023. 

“Assessing your risk to lightning before a storm enables homeowners and business owners to predict and mitigate their risks to losses due to a lightning strike,” said Triple-I CEO Sean Kevelighan. 

If any of the following structures are hit by lightning, there are consequences beyond the repairs from a fire. When there are surges and/or damages to the electrical system, here are just a few consequences that impact time, money, and – in the worst cases – can cost lives:

Homes: Costly repairs and equipment replacement (TVs, washer/dryer, computers);  

Businesses: Emails and communication stopped, production downtime and loss of revenue; and

Critical Facilities: Inability to meet the emergencies of individuals or the community. 

Lightning protection systems are scientifically proven to mitigate these risks. When properly installed, a lightning protection system makes a building resilient to the damage of lightning strike. These systems protect the structure, the electrical system, and the humans within the building.

Lightning risk assessment

From homeowners to design/build experts, learning how to measure and mitigate the risks of lightning is vital to the prevention of lightning damage. For personal safety, assess the current and future weather conditions; if you see lightning, get indoors. For protecting homes, buildings, and structures, there are a few ways to conduct an assessment to determine the risks of lightning. If the assessment determines that there are perceived risks of lightning, lightning protection systems can be installed to mitigate those risks.

Key assessment factors

The NFPA 780 standard for lightning protection is one option that offers a simple and complex approach to assessments. At the advanced level, an assessment involves a complex equation with several variables (ie., Nd= Ngx Aex C1 x10-6). At the very least, consider the key assessment factors within three general areas of a structure: 

  • External criteria
  • Structure, design, and use
  • Internal activity

External Criteria

When you first walk up to a building or structure, scan the surroundings and conduct a visual inspection. This involves identifying potential lightning strike paths, such as tall trees, antennas, or nearby structures. Evaluate the building’s height and design. Now, assess how that structure compares to other buildings or objects near it. 

  • Is it the tallest building? 
  • Is it situated on a hill or by itself?

If you are designing a new building, assess how that building will be incorporated into these surroundings to ensure proper consideration for making that building more sustainable to a lightning strike.

What is the propensity for lightning strikes in that city, county, or state? Different regions have varying levels of lightning activity, and this information is crucial in determining the necessary level of protection. Lightning frequency data can be obtained from local weather services or scientific experts, such as Vaisala, who collect data on lightning activity. 

Structure Design and Use

Evaluate the materials and use of the building.

  • What are the building materials: Glass, wood, brick, etc.? 
  • Does the design impact the propensity for a lightning strike: Taller points or roof attachments?
  • What is the use of the building: 
    • Does it contain hazardous or flammable objects?
    • Does it store valuable and/or historical objects?
    • Does it perform critical services?

Internal Activity

Identify people and activity on the inside of the structure. 

  • Are there many people inside this structure? 
  • What’s the likely panic level if a building evacuation is necessary? 
  • Can the people move quickly? For instance: In a nursing home or hospital, all occupants cannot quickly exit a building that was hit by lightning. In a large high-rise with large groups of occupants, a speedy exit may not be possible.

What is the building’s function? Identify the services that are being conducted in that building. If lightning hits the structure you are assessing, what happens to the people and services inside? Here are some key structures to protect in high-risk areas:

  • Data centers
  • Distribution centers
  • Schools and churches
  • Public works facilities
  • Critical facilities, such as fire, police, hospitals, emergency operation centers

Assessment leads to mitigation and protection. Having a general understanding of a lightning risk assessment enables all of us to make better choices. Individuals and homeowners can protect themselves and their homes. Design/build experts and facility managers can make choices to ensure their buildings are more resilient, sustainable, and safer with lightning protection systems.

Proper steps for a formal assessment and installation

If your general assessment leads you to question the structure’s vulnerability, the NFPA 780 guidelines specify that the formal assessment process should be carried out by qualified professionals who are knowledgeable about lightning protection systems. These professionals may include lightning protection system designers, engineers, or certified installers who have undergone specific training and have a comprehensive understanding of the guidelines. 

By following the lightning assessment process outlined by NFPA 780, property owners can ensure that their lightning protection systems are properly designed, installed, and maintained. Proper installation protects structures from the devastating effects of lightning strikes and promotes the safety of individuals inside.


Predict & Prevent: From Data to Practical Insight

By Bob Marshall, co-founder and CEO, Whisker Labs

The insurance industry’s shift from assessing and pricing risks to predicting and preventing losses – thereby improving insurance availability and affordability – is well underway. Even a casual look at the trade press reveals insurers adopting technologies and data-driven strategies that help businesses, families, and communities improve their risk profiles.

This data-driven movement does more than simply contain insurance costs – it’s driving improved customer engagement, affinity, and retention and creating opportunities beyond the transactional. Data clarity is crucial for all stakeholders, from insurers to first responders utilities, policymakers and – most important – homeowners.  Accurate data enables proactive measures that can prevent fires from happening.

We’re seeing this with our insurance IoT offering, Ting. Ting prevents home fires by identifying unique signals generated by tiny electrical arcs, the precursors to imminent fire risks. These signals are incredibly small but are clearly visible to Ting’s advanced detection technology. Ting has been found to prevent 80 percent of home electrical fires – and, beyond its ability to predict and prevent, we have found that Ting holds even greater significance for organizations that want to bring greater clarity and value to their current data ecosystems.

Over the past few years, we’ve built the world’s most knowledgeable electrical fire prevention team, which has been instrumental in the evolution of Ting’s machine learning and AI. Our Fire Safety Team has found that existing electrical fire data, while helpful and directional, needs greater accuracy and completeness. This is not due to a lack of care. We’re talking about an exceptionally hard problem – codifying fires after the fact. It is at this critical point where data from IoT devices like Ting becomes indispensable.

More than 50 percent of insurance claims for fire are often coded in the “unknown/underdetermined” category. Of these, fire chiefs and forensic fire engineers suggest more than half are likely electrical-related, but lack of resources prevent them from determining exact causation beyond a reasonable doubt, so they simply default to “unknown.” Ting data continues to document important and first of its kind findings around the origin of electrical fires.

Our ‘why’ behind predict and prevent

A horrific loss from an electrical fire in my family prompted the question: “Why can’t faults be identified well before they can evolve into a fire?”

Electricity is one of the most dangerous forces in nature, yet one of our most critical resources; our growing reliance poses increasing risks to homes, businesses, and communities. Recent U.S. Fire Administration data reveals a sobering trend. The 10 years from 2012 through 2021 saw reduced cooking, smoking, and heating fires; however, in stark contrast, electrical fires saw an 11 percent increase over that same period. Fire ignitions with an undetermined cause increased equally by 11 percent.  

Our pursuit to address these trends has brought us and our insurance partners here: Nearly 400,000 home-years of data, 6,000 remediated hazards; an insurance-forward IoT and telematics platform with full turnkey delivery; and most notably, hundreds of thousands of customers thrilled that their insurance company is doing more for them than reactively paying claims.  

Beyond the home’s walls

But Ting’s value is not limited to inside the home. While every Ting sensor is monitoring each home’s electrical activity to help predict and prevent fires, collectively the Ting network is aggregating data from across the broader utility grid. Specifically, it can help predict and prevent faults on the grid, enabling operators to proactively address risks that might otherwise lead to catastrophic, loss-generating events like wildfires.

A diagram of a transmission tower

Description automatically generated

Data drives insights

Given that many electrical-related fires are coded not as electrical but as “unknown” in fire incident databases, we’ve learned that comparing “prevented fires” to claims after a fire must consider a broader set of fire claims across a book of business, not just those with a secondary cause of “electrical.” All unknown fires and any claim that could even be electrical-related should be included in the broader set of claims. Excluding claims that can reasonably and accurately be removed — such as arson, lightning, earthquakes, and wildfire-related home fires — the data reveals a one-third reduction in the broader category of fires across the “Ting cohort” versus the “non-Ting cohort.” This results in a strong ROI for insurers.

Beyond prevention metrics, we’ve learned a lot, and Ting continues to learn daily and provide statistically significant actuarial impacts. With fully documented and mitigated hazards identified in 1 in 68 homes, the cases – or “saves” – are documented in detail in a peer-reviewed whitepaper, the latest version published on June 1, 2023. By design, each identified and remediated hazard is carefully reported through a highly standardized process to ensure high-quality, consistent data. 

Upon analyzing this statistically significant data, a recurring theme surfaced: The longstanding perception of the electrical fire problem requires new thinking. Below, I highlight three surprising, objective observations revealed by Ting data that support this notion:

  1. There is a common misconception that electrical fires are largely due to older home wiring infrastructure. Yet, we have found that 50 percent of home electrical fire hazards stem from failing or defective devices and appliances, with the other half attributed to home wiring and outlets. This finding is reflected in the chart below, breaking down the location and types of home electrical fire hazards, with a breakout of those stemming from devices and appliances.
  2. What may seem more surprising is that the electric utility grid can be a significant fire risk factor inside the home – not just a community fire risk. Nearly 50 percent of all hazard cases trace back to a root cause outside the house in the form of a grid equipment fault. These faults result in dangerous power entering the home. These conditions endanger a home and its occupants and can cause a shock hazard, damage equipment, and sensitive electronics, and worse, ignite a fire. Utility repair crews often share that a hazard impacted multiple homes in the immediate area, not just the home protected by Ting.
  3. One last finding that runs counter to conventional thinking about electrical fire risk comes in the form of a home-age “bias.” Logically, most of us assume the older the home, the higher the risk. In general, this holds when considering the effects of age and use on existing wiring infrastructure – all other things being equal. However, this assumption falls apart when considering all other factors, such as materials, build quality, and the standards and codes at that time. In fact, with the prevention data that flows in each day from our Fire Safety Team, we have built predictive models for home fire risk; early indications are that these models are demonstrating skill and will lead to a better, more informed view of risk – and of course – even better prevention.

I’m amazed at how our initial objective preventing residential fires has evolved to take on such a broad scope. New data spawns new thinking and new opportunities. Objective data is essential to validating the efficacy of any initiative seeking to prevent losses. Predicting and preventing fires is in the interest of all – especially homeowners and their families.

Colorado’s Life Insurance Data Rules Offer Glimpse of Future for P&C Writers

The Colorado Division of Insurance’s recent adoption of regulations to govern life insurers’ use of any external consumer data and information sources is the first step in implementing legislation approved in 2021 aimed at protecting consumers in the state from insurance practices that might result in unfair discrimination.

Property/casualty insurers doing business in Colorado should be keeping an eye on how the legislation is implemented, as rules governing their use of third-party data will certainly follow.

The implementation regulations, which have been characterized as a “scaling back” of a prior draft release in February, require life insurers using external data to establish a risk-based governance and risk-management framework to determine whether such use might result in unfair discrimination with respect to race and remediate unfair discrimination, if detected. If the insurer uses third-party vendors and other external resources, it is responsible under the new rules for ensuring all requirements are met.

Life insurers must test their algorithms and models to evaluate whether any unfair discrimination results and implement controls and process to adjust their use of AI, as necessary. They also must maintain documentation including descriptions and explanations of how external data is being used and how they are testing their use of external data for unfair discrimination. The documentation must be available upon the regulator’s request, and each insurer must report its progress toward compliance to the Division of Insurance.

The revised draft no longer focuses on “disproportionately negative outcomes” that would have included results or effects that “have a detrimental impact on a group” of protected characteristics “even after accounting for factors that define similarly situated consumers.” Removing that term altogether, the revised draft shifts focus to requiring “risk-based” governance and management frameworks.

This change is significant. As Triple-I has expressed elsewhere, risk-based pricing of insurance is a fundamental concept that might seem intuitively obvious when described – yet misunderstandings about it regularly sow confusion. Simply put, it means offering different prices for the same level of coverage, based on risk factors specific to the insured person or property. If policies were not priced this way – if insurers had to come up with a one-size-fits-all price for auto coverage that didn’t consider vehicle type and use, where and how much the car will be driven, and so forth – lower-risk drivers would subsidize riskier ones.

Risk-based pricing allows insurers to offer the lowest possible premiums to policyholders with the most favorable risk factors. Charging higher premiums to insure higher-risk policyholders enables insurers to underwrite a wider range of coverages, thus improving both availability and affordability of insurance. This straightforward concept becomes complicated when actuarially sound rating factors intersect with other attributes in ways that can be perceived as unfairly discriminatory.

Algorithms and machine learning hold great promise for ensuring equitable pricing, but research has shown these tools also can amplify any biases in the underlying data. The insurance and actuarial professions have been researching and attempting to address these concerns for some time (see list below).

Want to know more about the risk crisis and how insurers are working to address it? Check out Triple-I’s upcoming Town Hall, “Attacking the Risk Crisis,” which will be held Nov. 30 in Washington, D.C.

Triple-I Research

Issues Brief: Risk-Based Pricing of Insurance

Issues Brief: Race and Insurance Pricing

Research from the Casualty Actuarial Society

Defining Discrimination in Insurance

Methods for Quantifying Discriminatory Effects on Protected Classes in Insurance

Understanding Potential Influences of Racial Bias on P&C Insurance: Four Rating Factors Explored

Approaches to Address Racial Bias in Financial Services: Lessons for the Insurance Industry

From the Triple-I Blog

Illinois Bill Highlights Need for Education on Risk-Based Pricing of Insurance Coverage

How Proposition 103 Worsens Risk Crisis in California

It’s Not an “Insurance Crisis” – It’s a Risk Crisis

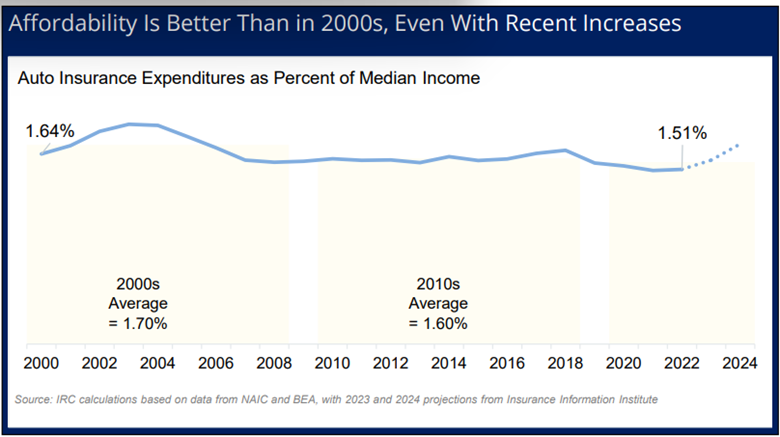
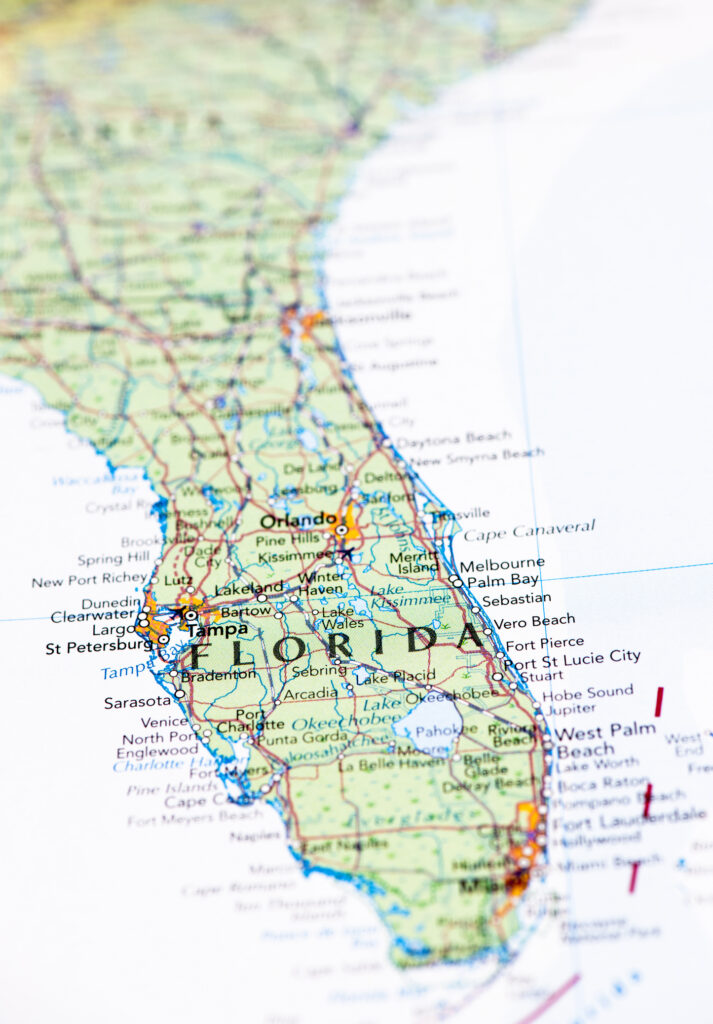
IRC Outlines Florida’s Auto Insurance Affordability Problems

Education Can Overcome Doubts on Credit-Based Insurance Scores, IRC Survey Suggests

Matching Price to Peril Helps Keep Insurance Available and Affordable

Attacking the Risk Crisis: Roadmap to Investment
in Flood Resilience

As part of its attack on the risk crisis, Triple-I recently participated in a project led by the National Institute of Building Sciences (NIBS) to develop a roadmap for mitigation investment incentives. The Resilience Incentivization Roadmap 2.0 builds off research NIBS published in 2019 and focuses on urban pluvial flooding, though many of the principles can be applied to riverine and coastal flooding, as well as non-flood perils.

The roadmap draws heavily from voluntary programs that have seen success in the context of other risks – such as the Insurance Institute for Business & Home Safety (IBHS) FORTIFIED Home™ Standard and the California Earthquake Authority’s Brace + Bolt retrofit program.

“Pluvial urban flooding” refers to rainwater that can’t flow downhill fast enough to reach streams and stormwater systems and therefore backs up into buildings. Much of the inland flooding caused by Hurricane Ida (2021), Hurricane Ian (2022), and more recent flooding in California due to “atmospheric rivers” and in the Northeast would fall under this category. Common low-cost measures exist to protect buildings from such flooding, and the relative ease and affordability of such mitigations made pluvial urban flooding an appropriate initial target.

This project was a collaboration representing stakeholders in the built environment – lenders, developers, insurers, engineers, agencies, policymakers – with the goal of helping communities develop layered mitigation investment packages. Triple-I’s role was to represent the property/casualty insurance industry as a stakeholder and co-beneficiary of investment in advance mitigation and resilience.

Insurers have strong incentives to encourage policyholders to make improvements that reduce the risk of costly claims. In the case of flood risk – an increasingly expensive peril outside FEMA-designated flood zones – encouraging such improvements is preceded by a different challenge: persuading homeowners to obtain flood insurance.

About 90 percent of U.S. natural disasters involve flooding. Estimates of size of the “flood protection gap” vary widely among experts, but illustrations worth noting include:

  • Less than 25 percent of buildings inundated by Hurricanes Harvey, Sandy, and Irma had flood coverage;
  • Inland areas hardest hit by the remnants of Hurricane Ida in 2021 were in areas in which less than 2 percent of properties had federal flood insurance;
  • In 2022, historic flooding in and around Yellowstone National Park affected areas in which only 3 percent of residents have federal flood insurance; and
  • More recently, precipitation from atmospheric rivers affecting the U.S. West Coast has resulted in an unparalleled weather event not experienced in several decades, with much of the activity affecting areas with low flood-insurance purchase rates.

For decades, U.S. insurers considered flood risk “untouchable” because of how hard it is to quantify their risk. As a result, flood is excluded under standard homeowners and renters policies, but coverage is available from FEMA’s National Flood Insurance Program (NFIP) and a growing number of private insurers that have gained confidence in recent years in their ability to underwrite this risk using sophisticated risk modeling.

Consumer research has consistently shown that some of the most common reasons for not buying flood insurance include:

  • An erroneous belief that flood risk is covered under standard homeowners insurance;
  • If the mortgage lender doesn’t require flood insurance, it must not be necessary; and
  • The coverage is too expensive.

The roadmap provides findings and specific recommendations developed by its multidisciplinary team of authors in collaboration with broad and diverse participation of stakeholder group members. The NIBS Committee on Finance, Insurance, and Real Estate (CFIRE) will host a webinar on October 18 to go over these findings and recommendations. In addition, CFIRE chair Dan Kaniewski will be a participant in Triple-I’s November 30 Town Hall: Attacking the Risk Crisis in Washington, D.C.

A close-up of a logo

Description automatically generated

Learn More:

Triple-I “State of the Risk” Issues Brief: Flood

Shutdown Threat Looms Over U.S. Flood Insurance

FEMA Incentive Program Helps Communities Reduce Flood Insurance Rates for Their Citizens

More Private Insurers Writing Flood Coverage; Consumer Demand Continues to Lag

NAIC Seeks Granular Data From Insurers to Help Fill Local Protection Gaps

Kentucky Flood Woes Highlight Inland Protection Gap

Inland Flooding Adds a Wrinkle to Protection Gap

How Proposition 103 Worsens Risk Crisis
In California

California is not the only U.S. state struggling with insurance availability and affordability, but — as described in a new Triple-I Issues Brief — its problems are exacerbated by a three-decades-old legislative measure that severely constrains insurers’ ability to profitably insure property in the state.

Instead of letting insurers use the most current data and advanced modeling technologies to inform pricing, Proposition 103 requires them to price coverage based on historical data alone. It also bars insurers from incorporating the cost of reinsurance into their prices.

Insurers’ underwriting profitability is measured using a “combined ratio” that represents the difference between claims and expenses insurers pay and the premiums they collect. A ratio below 100 represents an underwriting profit, and one above 100 represents a loss. 

As the chart shows, insurers have earned healthy underwriting profits on their homeowners business in all but two of the 10 years between 2013 and 2022. However, the claims and expenses paid in 2017 and 2018 – due largely to wildfire-related losses – were so extreme that the average combined ratio for the period was 108.1.

Underwriting profitability matters because that is where the money comes from to maintain “policyholder surplus” – the funds insurers set aside to ensure that they can pay future claims. Integral to maintaining policyholder surplus is risk-based pricing, which means aligning underwriting and pricing with the cost of the risk being covered. Insurers hire teams of actuaries and data scientists to make sure pricing is tightly aligned with risk, and state regulators and lawmakers closely scrutinize insurers to make sure pricing is fair to policyholders.

To accurately underwrite and price coverage, insurers must be able to set premium rates prospectively. As shown above, one or two years that include major catastrophes can wipe out several years of underwriting profits – thereby contributing to the depletion of policyholder surplus if rates are not raised.

California is a large and potentially profitable market in which insurers want to do business, but current loss trends and the constraints of Proposition 103 have caused several to reassess their appetite for writing coverage in the state. Wildfire losses, combined with events like early 2023’s anomalous rains and, more recently, Hurricane Hilary, increase the urgency for California to continue investing in risk reduction and resilience. The state also needs to update its regulatory regime to remove impediments to underwriting.

An effort in the state legislature to rectify some of the issues making California less attractive to insurers failed in September 2023. With fewer private insurance options available, more Californians are resorting to the state’s FAIR plan, which offers less coverage for a higher premium.

Want to know more about the risk crisis and how insurers are working to address it? Check out Triple-I’s upcoming Town Hall, “Attacking the Risk Crisis,” which will be held Nov. 30 in Washington, D.C.

A close-up of a logo

Description automatically generated

It’s Not an “Insurance Crisis” — It’s a Risk Crisis

Ten states – Louisiana, Florida, Idaho, Kentucky, Mississippi, Montana, North Dakota, South Carolina, Texas, and Virginia – as well as additional plaintiffs, are suing the Federal Emergency Management Agency (FEMA) over its new methodology for pricing flood insurance, Risk Rating 2.0. On Sept. 14, a federal hearing lasted six hours as the plaintiffs sought a preliminary injunction to halt the new pricing regime while the lawsuit plays out.

Many residents of these states are understandably upset about seeing their flood insurance premium rates rise under the new approach. There may not be much comfort for them in knowing that the current system is much fairer than the previous one, in which higher-risk homeowners subsidized those with lower risks. Similarly, policyholders who have had their premium rates reduced under Risk Rating 2.0 are unlikely to take to the streets in celebration.

These homeowners aren’t alone in seeing insurance rates rise – or even having to struggle to obtain insurance. And these difficulties aren’t confined to holders of flood insurance policies. Florida and California are two states in which insurers have been forced to rethink their risk appetite – due in part to rising natural catastrophe losses and in part to regulatory and litigation environments that make it increasingly difficult for insurers to profitably write coverage.

Even before the COVID-19 pandemic and Russia’s invasion of Ukraine – and the supply-chain and inflationary pressures they created – the property/casualty insurance market was hardening as insurers adjusted their pricing and their risk appetites to keep pace with conditions that were driving losses up and eroding underwriting profitability – topics Triple-I has written about extensively (see a partial list below).

“Rising insurance rates are not the problem,” says Dale Porfilio, chief insurance officer at Triple-I. “They are a symptom of rising losses related to a range of factors, from climate and population trends to post-pandemic driving behaviors and surging cybercrime to antiquated policies, outdated building codes, fraud, and legal system abuse.”

In short, we are not experiencing an “insurance crisis,” as many media outlets tend to describe the current state of the market; we are experiencing a risk crisis. And even as the states referenced above push back against much-needed flood insurance reform, legislators in several states have been pushing measures that would restrict insurers’ ability to price coverage accurately and fairly – rather than addressing the underlying perils and forces aggravating them.  

Triple-I, its members, and a range of partners are working to educate stakeholders and decisionmakers and promote pre-emptive risk mitigation and investment in resilience. We are using our position as thought leaders and our unique non-lobbying role in the insurance industry to reach across sector boundaries and drive constructive action. You will be hearing more about these efforts over the next few months.

The success of these efforts will require a collective understanding among stakeholders and decisionmakers that for insurance to be available and affordable frequency and severity of risk must be measurably reduced. This will require highly focused, integrated projects and programs – many of them at the community level – in which all stakeholders (co-beneficiaries of these efforts) will share responsibility.

Want to know more about the risk crisis and how insurers are working to address it? Check out Triple-I’s upcoming Town Hall, “Attacking the Risk Crisis,” which will be held Nov. 30 in Washington, D.C.

Learn More:

Shutdown Threat Looms Over U.S. Flood Insurance

FEMA Incentive Program Helps Communities Reduce Flood Insurance Rates for Their Citizens

More Private Insurers Writing Flood Coverage; Consumer Demand Continues to Lag

Shift in Hurricane Season’s Predicted Severity Highlights Need for Prospective Cat Risk Pricing

California Needs to Make Changes to Address Its Climate Risk Crisis

Illinois Bill Highlights Need for Education on Risk-based Pricing of Insurance Coverage

IRC Outlines Florida’s Auto Insurance Affordability Problems

Education Can Overcome Doubts on Credit-Based Insurance Scores, IRC Survey Suggests

Matching Price to Peril Helps Keep Insurance Available & Affordable

Triple-I “State of the Risk” Issues Brief: Flood

Triple-I “State of the Risk” Issues Brief: Hurricanes

Triple-I Issues “Trends and Insights” Brief: Risk-Based Pricing of Insurance

Shutdown Threat Looms Over U.S. Flood Insurance

Even as the 2023 Atlantic hurricane season proves to be more intense than originally predicted, federal funding for the National Flood Insurance Program (NFIP) is threatened by a potential government shutdown. Funding for NFIP will expire after September 30 if lawmakers don’t reach a deal.

Claims on existing policies would still get paid if NFIP isn’t reauthorized. But the program would be unable to issue new policies and would face other funding constraints. If it can’t issue new policies, thousands of real estate transactions requiring flood coverage could be derailed. 

Insured losses from hurricanes have risen over just the past 15 years. When adjusted for inflation, nine of the 10 costliest hurricanes in U.S. history have struck since 2005. This is due in large part to the fact that more people have been moving into harm’s way since the 1940s, and Census Bureau data show that homes being built are bigger and more expensive than before. Bigger homes filled with more valuables means bigger claims when a flood occurs – a situation exacerbated by continuing replacement cost inflation.

Flooding isn’t just a problem for East and Gulf Coast communities. Inland flooding also is on the rise. In August 2021, Hurricane Ida brought heavy flooding to the Louisiana coast before delivering so much water to the northeast that Philadelphia and New York City saw flooded subway stations days after the storm passed. Floods in Eastern Kentucky in 2022 further underscored the need for more comprehensive planning on how to deal with these disasters and reduce the nationwide flood protection gap. California and the Pacific Northwest have been hit in recent years by drenching “atmospheric rivers” and, most recently, Hurricane Hilary, which slammed Southern California and neighboring Nevada, where it turned the Burning Man festival in the state’s northern desert into a dangerous mess of foot-deep mud and limited supplies.

Flood insurance is provided by NFIP and a small but growing number of private insurers, who have become increasingly comfortable writing the coverage since the advent of sophisticated modeling and analytical tools. Between 2016 and 2022, the total flood market grew 24 percent – from $3.29 billion in direct premiums written (DPW) to $4.09 billion – with 77 private companies writing 32.1 percent of the business.

Flood risk was long considered untouchable by private insurers, which is a large part of the reason the federally run NFIP exists. While private participation in the flood market is growing, NFIP remains a critical source of protection for this growing and underinsured peril.

Want to know more about the risk crisis and how insurers are working to address it? Check out Triple-I’s upcoming Town Hall, “Attacking the Risk Crisis,” which will be held Nov. 30 in Washington, D.C.

Learn More:

FEMA Incentive Program Helps Communities Reduce Flood Insurance Rates for Their Citizens

More Private Insurers Writing Flood Coverage; Consumer Demand Continues to Lag

Stemming a Rising Tide: How Insurers Can Close the Flood Protection Gap

Kentucky Flood Woes Highlight Inland Protection Gap

Inland Flooding Adds a Wrinkle to Protection Gap

State of the Risk Issues Brief: Flood

State of the Risk Issues Brief: Hurricanes

Michigan Drivers Benefit From No-Fault Reforms; Rulings Constrain Gains

By Max Dorfman, Research Writer, Triple-I

The success of Michigan’s no-fault insurance reforms at reining in claims and contributing to premium reductions for many drivers has been crimped by adverse court decisions in cases contesting the reforms and other factors, according to new research by two Triple-I non-resident scholars. 

Michigan can be viewed as “an experiment on both the promises and pitfalls of a grand vision for no-fault auto insurance,” say the authors, Patricia Born, Ph.D. of Florida State University and Robert Klein, Ph.D. of Temple University.  The policy brief, No-Fault Auto Insurance Reform in Michigan: An Initial Assessment Revised, updates prior research by the scholars. It evaluates the reforms and finds that – in addition to reduced claims and beneficial effects on many drivers’ premiums — “it also appears that the number of uninsured drivers has fallen significantly.”

Michigan’s high auto insurance premiums contributed to a large percentage of uninsured drivers. In fact, Michigan was estimated to have the second-highest percentage of uninsured drivers among the states in 2019, at nearly 26 percent.

“This motivated the state’s Governor and Legislature to significantly reform its no-fault law and revise its regulation of auto insurance,” the report says. “The reforms were enacted in 2019 and were phased in from 2019 through 2021. While these reforms and regulatory changes are relatively nascent, there is considerable interest in knowing their effects, including the consequences of eliminating unlimited medical benefits, instituting medical cost controls, and tightening auto insurance rate regulation.”

PIP costs in the state had previously caused skyrocketing premiums due to the high medical costs associated with this coverage. The researchers’ data demonstrates that PIP claims costs dropped significantly because of these reforms.

Additionally, Michigan’s verbal threshold for liability claims appears to have reduced auto insurance costs and premiums in Michigan relative to other states. However, these savings were engulfed by its high PIP costs prior to the reforms. With PIP costs decreasing, the overall cost of liability coverage has also declined.

Now, the number of uninsured drivers has also fallen as auto insurance has become more affordable due to the reforms. Overall, Michigan’s average auto insurance premium for all coverages dropped from $2,611 in 2019 to $2,112 in 2021 – an 18.3 percent decrease. From 2019 to the first quarter of 2023, the average liability premium declined from $825 to $629 – a 23.8 percent decrease. The average loss cost for PIP in Michigan fell almost 40 percent, from $465 in 2019 to $280 in 2023.

Despite these benefits, the paper says, “There are stakeholders who question whether the reforms have created a better system and are seeking to reverse or modify some of them.”

According to the study, some drivers expected greater premium savings than they have received.  Other parties who benefited from the old system (for example, medical providers and trial attorneys) “are seeking to reverse or temper at least some of the reforms that were enacted,” the paper says.

PIP claims costs have begun to rise within the last year due to recent adverse court rulings, as well as other factors, such as more frequent auto accidents.

Learn More:

Michigan No-Fault Reform Yields Fewer Claims, Lower Premiums

Despite Fewer Claims, Personal Auto Insurance Payouts Increase

IRC: Consumers Deem
Most Rating Factors Fair

By Max Dorfman, Research Writer, Triple-I

Most consumers believe the majority of personal insurance rating factors that insurers use to underwrite and price homeowners and auto coverage are fair, according to a new survey by the Insurance Research Council (IRC) – like Triple-I, an affiliate of The Institutes.

But there was some variation regarding which variables they consider fair.

Overall, consumers were more favorable toward factors they perceived to be directly related to the risk of the insured property (condition of the home, cost of rebuilding, miles driven, vehicle information, etc.). They were less likely to rank fair on aspects connected to the insured’s personal profile.

The study, Public Perceptions Regarding the Fairness of Insurance Rating Factors, focused on homeowners and personal auto insurance. IRC found that all 19 homeowners insurance rating factors were assessed to be fair by most respondents, and the majority deemed 10 of the 14 personal auto factors.

Insurance companies use statistically predictive rating variables to assess risk and determine policy prices, helping to accurately align premiums with risk and offer coverage to higher-risk consumers. The variables consider several socioeconomic factors to determine these coverage costs, including gender, age, education, and credit-based insurance scores.

“Given how inflation and other factors have driven up the cost of auto and homeowners insurance in recent years, IRC was not surprised to learn that paying for these essential coverages has been a financial burden for a sizable number of Americans,” said IRC president and Triple-I chief insurance officer Dale Porfilio.  “Yet, at the same time, consumers expressed widespread support in our survey for the fairness of the rating factors used by insurance carriers to price their auto and homeowners policies.”

Among personal auto factors, those most likely to be deemed fair included:

  • Traffic conviction record;
  • Driver’s loss/claim history; and
  • Driving behavior data from telematics.

However, the personal auto factors that were least likely to be considered fair were:

  • Education level;
  • Marital status; and
  • Gender of the driver.

Concerning homeowners insurance, the most fair factors included:

  • The use of safety systems
  • Condition of home; and
  • The estimated cost of rebuilding.

Least agreeable factors for homeowners involved:

  • Credit history;
  • Condition of surrounding building; and
  • The data from a connected device.

Previous IRC research that focused on consumer attitudes about the use of credit history as an insurance rating factor found that skepticism about the link between credit and future insurance claims declines when the predictive power of credit-based insurance scores is explained to them.

NAIC Seeks Granular Data From Insurers to Help Fill Local Protection Gaps

Data is at the core of risk management, and the National Association of Insurance Commissioners (NAIC) is seeking to identify gaps in the data state regulators collect from insurers – particularly with respect to understanding insurance availability and affordability.

“The increasing frequency and severity of weather events, rising reinsurance costs, and inflationary pressures are making property insurance availability and affordability more challenging for a growing number of regions across the U.S.,” the NAIC said in a statement during its Summer National Meeting in August. “These dynamics can vary within a relatively small geographic area, so while a state’s property insurance market may be generally healthy overall, there can be localized protection gaps that challenge certain communities.”

The NAIC said states may lack the kind of data needed to gauge the availability and affordability of insurance for consumers. Under Alan McClain, Arkansas insurance commissioner and chair of the NAIC Property and Casualty Committee, insurance regulators of at least 30 states have started work to identify where data is lacking. The plan is to develop a data template to establish “a long-term, robust data collection strategy to help regulators more nimbly respond to inquiries related to their property markets versus a one-time data call.”

This approach contrasts with one proposed last year by the U.S. Treasury’s Federal Insurance Office (FIO). In its request for information (RFI), FIO proposed collecting data related to “insurers’ underwriting metrics and related insurance policy information.”  It said the data “is needed in order for FIO to identify and more accurately assess the financial impact of weather-related events on insurers’ exposures and underwriting over time. FIO’s analysis would assess insurance availability and its effects on policyholders, particularly in regions of the country with the potential for major disruptions of private insurance coverage due to climate-related disasters.”

Triple-I responded to the FIO RFI by saying, in part, that:

  • The proposed call was duplicative and would ultimately hurt the people FIO wants to help;
  • The ZIP Code-level data FIO said it was seeking could lead to misleading conclusions; and
  • FIO could secure the information it needs from existing, publicly available data without placing an additional reporting burden on insurers.

Triple-I provided an extensive but not exhaustive list of resources for FIO to consider.

“There is no dearth of information to help FIO and policymakers address the conditions contributing to climate risk and drive the behavioral changes needed in the near, intermediate, and long term,” Triple-I wrote, reminding FIO that catastrophe-modeling firms prepare their industry exposure databases from public sources, not insurer data calls. “What is needed is to build on existing efforts and draw on the voluminous data and analysis already extant to target problem areas that are well understood.”

NAIC’s response to the RFI emphasized the importance of collaboration to address concerns about insurance availability and affordability and expressed displeasure at what it characterized as FIO’s “unilateral process.”

“While we recognize the Treasury’s desire to better understand the impact of climate risk and weather-related exposures on the availability and affordability of the homeowners’ insurance market,” NAIC wrote, “we are disappointed and concerned that Treasury chose not to engage insurance regulators in a credible exercise to identify data elements gathered by either the industry or the regulatory community.”

In a June 2023 report, FIO references the RFI and describes the proposed data call, stating that the comment period closed in December 2022 and that FIO is “assessing next steps.” The June report recognizes and commends the industry’s and the NAIC’s efforts to date but goes on to say that these efforts “are fragmented across states and limited in several critical ways.”

FIO makes 20 recommendations, and the report provides context for each, highlighting efforts already under way and explaining how implementation of the FIO recommendations could improve management and supervision of climate-related risks. It also proposes areas of focus for future work by state insurance regulators and the NAIC.

Learn More:

Data Call Would Hinder Climate-Risk Efforts More Than It Would Help

Federal Insurance Office (FIO) request for information (RFI)

Triple-I response to FIO RFI