Rising natural disaster costs, increased home repair expenses, and legal system challenges have made homeowners’ insurance significantly less affordable across the United States over the past two decades, according to new research from the Insurance Research Council. The trend shows no signs of slowing.
The financial burden of protecting one’s home has grown substantially. With homeowners insurance expenditures growing much faster than incomes over the past two decades, American households now dedicate an increasing share of their income to insurance premiums.
In 2001, homeowners typically spent about 1.19 percent of their household income on insurance coverage. This figure climbed to 2.09 percent – a 75 percent increase – by 2022, the most recent available year’s data.
Projections of average premiums from the Insurance Information Institute suggest the trend will continue escalating, with estimates indicating households could spend 2.4 percent of their income on homeowners’ insurance by 2024 – the highest level recorded in more than two decades.
Wide variation by state
Utah emerged as the most affordable state in 2022, where residents spent only 1.00 percent of their income on homeowners’ insurance. Other states offering relative affordability included Oregon (1.09 percent), Alaska (1.23 percent), and Maryland (1.27 percent).
Louisiana ranked as the least affordable, with households dedicating 4.22 percent of their income to homeowners’ insurance. Disaster-prone states dominated the least-affordable rankings, with Florida (3.99 percent), Mississippi (3.87 percent), and Oklahoma (3.45 percent), following the Pelican State.
Multiple Cost Pressures
The affordability crisis stems from interconnected factors that have intensified pressure on insurance markets, according to IRC. Increased natural catastrophe risk represents a primary driver, with weather-related events becoming more frequent and severe.
Rising home construction and repair costs have compounded the challenge. Supply-chain disruptions have inflated material prices and extended project timelines, directly impacting claim settlements. When homes require repairs or replacement, insurers face significantly higher costs than in previous years, necessitating premium adjustments to maintain financial stability.
Population migration patterns have exacerbated risk concentrations, with more Americans moving to areas susceptible to natural disasters, the report noted. Coastal regions prone to hurricanes, wildfire-vulnerable areas, and tornado-prone territories have seen increased development, creating larger pools of exposed properties that insurers must protect.
Litigation has added another layer of complexity. Insurance companies report challenges with fraud, excessive claims, and legal system abuse following catastrophic events. The expense index – measuring what insurers spend to process, investigate, and litigate claims as a percentage of incurred losses – varies significantly across states, with litigation rates affecting overall costs.
By Sayon Deb, Director of Insights, UL Standards & Engagement
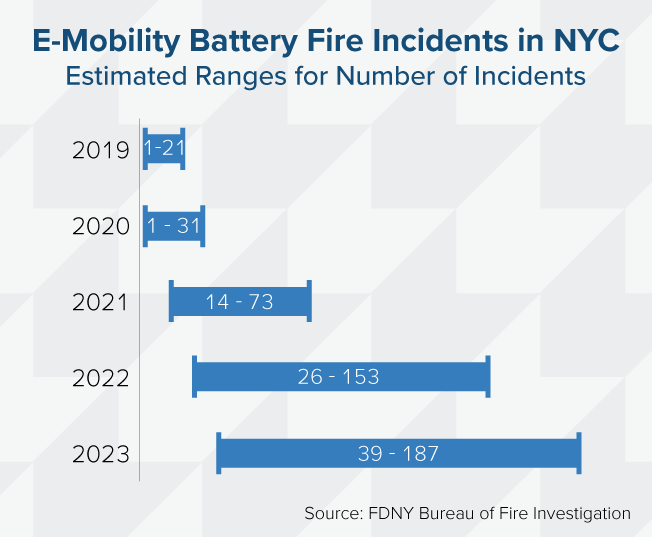
In just five years, lithium-ion battery fires linked to e-mobility devices have evolved from a fringe risk into a mainstream safety and liability crisis – particularly in dense urban areas, like New York City, where adoption of these devices has outpaced regulatory safeguards.
In addition to the obvious public safety threat, e-mobility battery related fires represent a significant and expanding liability exposure for insurers, property managers, and city agencies. Our latest report – developed in collaboration with Oxford Economics – sets out to answer a more fundamental question: What is this crisis truly costing the city?
The answer, conservatively estimated, is up to $519 million in combined human and economic loss between 2019 and 2023. This figure includes fatalities, injuries, and structural property damage
Why Now? Why New York?
The dramatic rise in fire incidents – an estimated eightfold increase from 21 in 2019 to as many as 187 incidents in 2023 – correlates strongly with the influx of low-cost, uncertified e-bikes and scooters. New York City’s unique combination of traffic congestion, delivery-based gig work, and dense multi-family housing has made it a case study in how quickly innovation can outstrip risk management.
Data from the Fire Department of New York, the Consumer Product Safety Commission, and UL Solutions’ Lithium-Ion Battery Fire Incident Database formed the foundation of our modeling. This helped us generate incident estimates of fatalities, injuries, and structural properties damages.
Oxford Economics translated these incident reports into cost estimates using a rigorous, conservative methodology by applying federal valuation metrics for loss of life and injury. Fatality costs were calculated using the U.S. Department of Transportation’s Value of a Statistical Life, set at $13.2 million per life as of 2023. Non-fatal injury costs were derived as severity-weighted fractions of that value, ranging from minor injury to critical injury, in accordance with DOT and Office of Management and Budget economic guidance.
Our analysis then integrated structural fire cost benchmarks from both Triple-I and the National Fire Protection Association. Triple-I’s data was particularly important in defining the upper-bound estimates for property loss. Claims data on the average insurance payout for residential fire damage provided a grounded, actuarial counterweight to NFPA’s generalized national averages.
This dual-source approach allowed us to capture a more realistic range of likely losses across different housing types, from NYCHA public units to private homes.
A growing blind spot for insurers
From a risk-modeling standpoint, e-mobility fire incidents don’t map easily to conventional insurance categories. Many e-mobility users, particularly gig economy workers, rely on leased, used, or modified e-bikes and e-scooters to meet delivery demands. Some of these devices are powered by third-party or uncertified batteries or, in some instances, contain second-hand components. This creates a messy risk environment in which it’s hard to know who owns what, how it has been maintained, or how it’s being used. Moreover, fires resulting from these devices often fall outside the scope of standard product warranties or manufacturer responsibility. This makes it difficult to determine who’s responsible when something goes wrong.
For insurers, this presents a growing blind spot. Traditional assumptions around property and contents coverage did not include high-risk devices charged in hallways or shared living spaces or for ignition sources that are not part of conventional product recall channels.
A $300 imported battery with no certification can trigger a six-figure claim, and those risks are becoming more common.
The Path Forward
Regulatory momentum is improving. New York City’s Local Law 39, signed in 2023, bans the sale and lease of uncertified e-mobility devices. In July 2024, New York Governor Hochul enacted additional statewide measures to support battery safety and user education. Federal legislation aimed at establishing nationwide safety requirements for lithium-ion batteries used in e-bikes and e-scooters is making its way through Congress. While these are positive steps, enforcement and awareness remain uneven, leaving significant gaps in consumer protection and risk mitigation.
From our perspective at ULSE, a multi-pronged strategy is essential:
Better enforcement of safety standards for batteries and chargers.
More robust public education on safe charging practices.
Trade-in and swap programs that encourage delivery workers to discard unsafe batteries.
Underwriting models that consider device certification, consumer behavior, and building type.
Improved incident reporting frameworks that enable cities and insurers to collect better data and therefore better track risk exposure.
With better data, smarter standards, and more coordinated public-private action, the future of e-mobility will thrive with safety at its center.
Mr. Deb will be among the risk and insurance industry thought leaders speaking at Triple-I’s Joint Industry Forum (JIF) in Chicago on June 18, 2025. It’s not too late to register to attend this insight-driven event.
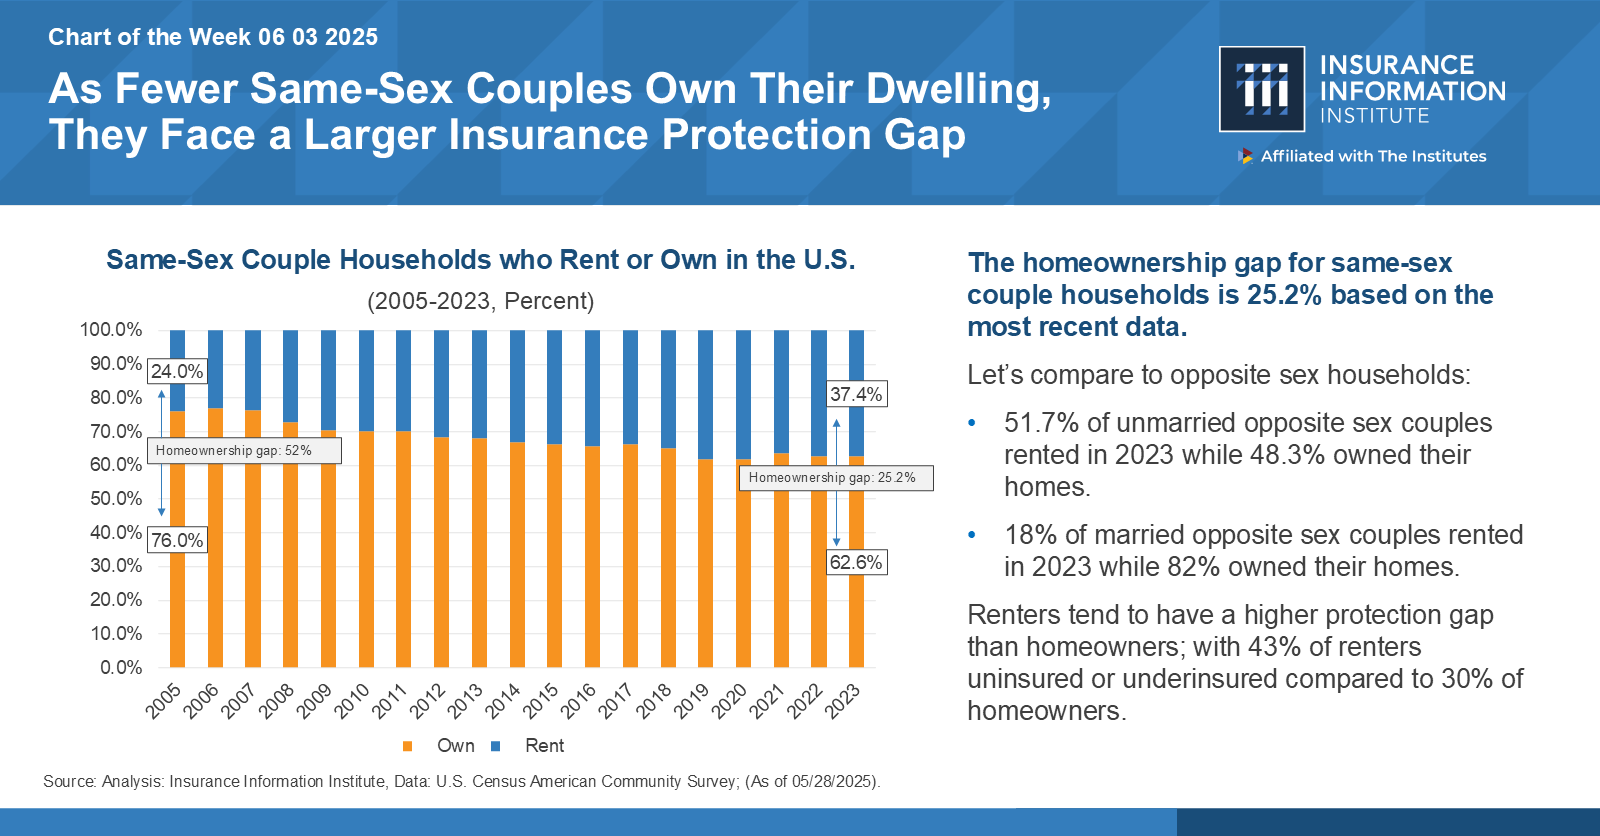
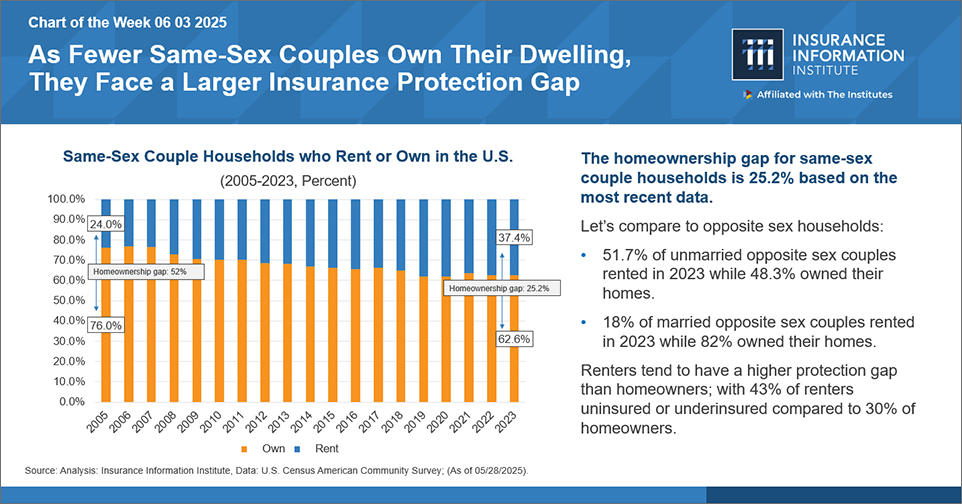
The homeownership gap for same-sex couple households is 25.2% based on the most recent data.
As part of an ongoing discussion on the link between the housing and insurance markets, the Insurance Information Institute (Triple-I) released a Chart of the Week (COTW), “As Fewer Same-Sex Couples Own Their Dwelling, They Face a Larger Insurance Protection Gap.” Based on data from 2023, 62.6 percent of same-sex households own their homes and 37.4 percent rent, representing a homeownership gap of 25.2 percentage points within this community. In comparison, 82 percent of married opposite-sex households own their homes, while only 18 percent rent.
In the United States, homeownership offers several benefits (versus renting) to those with the financial resources to achieve and sustain it. Owners can accrue equity to increase their chances of making a profit when they sell their home. They can reap tax benefits through mortgage deductions. Mortgage holders can also lower monthly housing costs when interest rates drop. Ultimately, a home can increase personal net worth and offer a mechanism to transfer wealth to the next generation. Protecting this asset and its contents makes good financial sense.
Renters may not own their dwelling, but they keep personal belongings in it. They can face serious financial risks in the event of a loss, theft, disaster, or personal liability event. Yet, according to the COTW, 43 percent of renters are uninsured or underinsured, compared to 30 percent of homeowners. There are several reasons attributable to this difference, but it’s essential to keep one at the forefront: insurance coverage requirements are commonplace in mortgage agreements but not in lease agreements. Thus, homeownership status can drive participation in the insurance market.
Examining factors that impede homeownership for same-sex couples might shed light on how to attract and retain more policyholders in this demographic. Looking closely at the interplay of just three of these – housing prices, geography, and legislative environment – reveals that housing tends to be more expensive in LGBTQIA+-friendly areas. Prospective buyers may need to earn at least $150,000 a year – as much as 50 percent more – to avoid living in regions without basic legal protections, according to a recent study of real estate market data across 54 major U.S. metropolitan areas.
High monthly housing costs strain budgets, pushing homeowners and renters out of the insurance market. It can also put the financial qualifications for home buying – i.e., building credit and savings – out of reach. Households are considered cost-burdened when they spend more than 30 percent of their income on rent, mortgage payments, and other housing costs, according to the U.S. Department of Housing and Urban Development (HUD).
Nationwide, renters hadhigher median housing costs as a percentage of their income (31.0 percent) compared to homeowners (21.1 percent for homeowners with a mortgage and 11.5 percent for those without a mortgage). In metropolitan areas that welcome and protect diversity, renters are more likely to behousing cost-burdened, particularly in New York (52.1 percent of residents pay more than 30 percent of their income) and San Francisco (37.6 percent of residents). Renters in states and municipalities where legislation is considerably less welcoming but rents are lower can face comparativelyhigher premiums for rental coverage.
Despite the legalization of same-sex marriage and various anti-discrimination laws, the LGBTQ community still battles considerable discrimination and systemic biases in many areas of life, including housing. Insurers can work to better understand the diverse needs of LGBTQIA+ individuals, couples, and their families, facilitating more effective solutions for managing financial risks. And most importantly, the industry can improve communication around potential coverage benefits for these households.
“We can start closing the protection gap by having people at the table who understand the lived experiences behind the numbers,” says Amy Cole-Smith, Executive Director for BIIC/ Director of Diversity at The Institutes.
For example, renters might find it helpful to know their policy covers a loss event linked to discrimination against them, such as malicious damage or vandalism to the property by a third party. Even when it’s evident the destruction isn’t the renter’s fault, the landlord might still attempt to hold them responsible, either through a lawsuit, a rent increase, or eviction. Additionally, unmarried couples should be informed about whether the insurer includes both partners’ names on a policy and how this provision affects them in the event of a claim.
“Cultivating an inclusive workforce drives smarter solutions, like renters’ insurance that aligns with the realities of same-sex couples, more equitable underwriting, and marketing that truly resonates,” Cole-Smith says. “This isn’t just about equity—it’s about unlocking growth and staying competitive in a changing market. When the insurance workforce reflects the diversity of the market, we’re in a stronger position to build products that meet people where they are.”
Triple-I works to advance the conversation around crucial issues in the insurance industry, including Talent and Recruitment. To join the discussion, register for JIF 2025. We also invite you to follow our blog to learn more about trends in insurance affordability and availability across the property/casualty market.
By Loretta L. Worters, Vice President, Media Relations, Triple-I
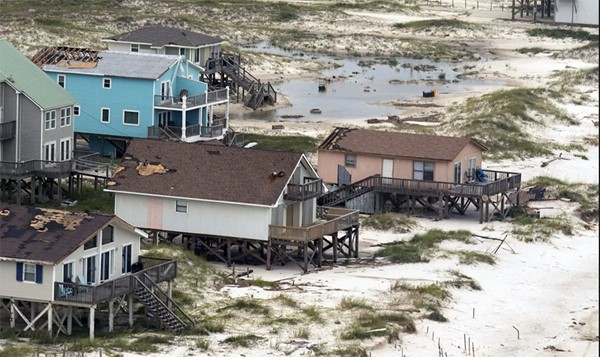
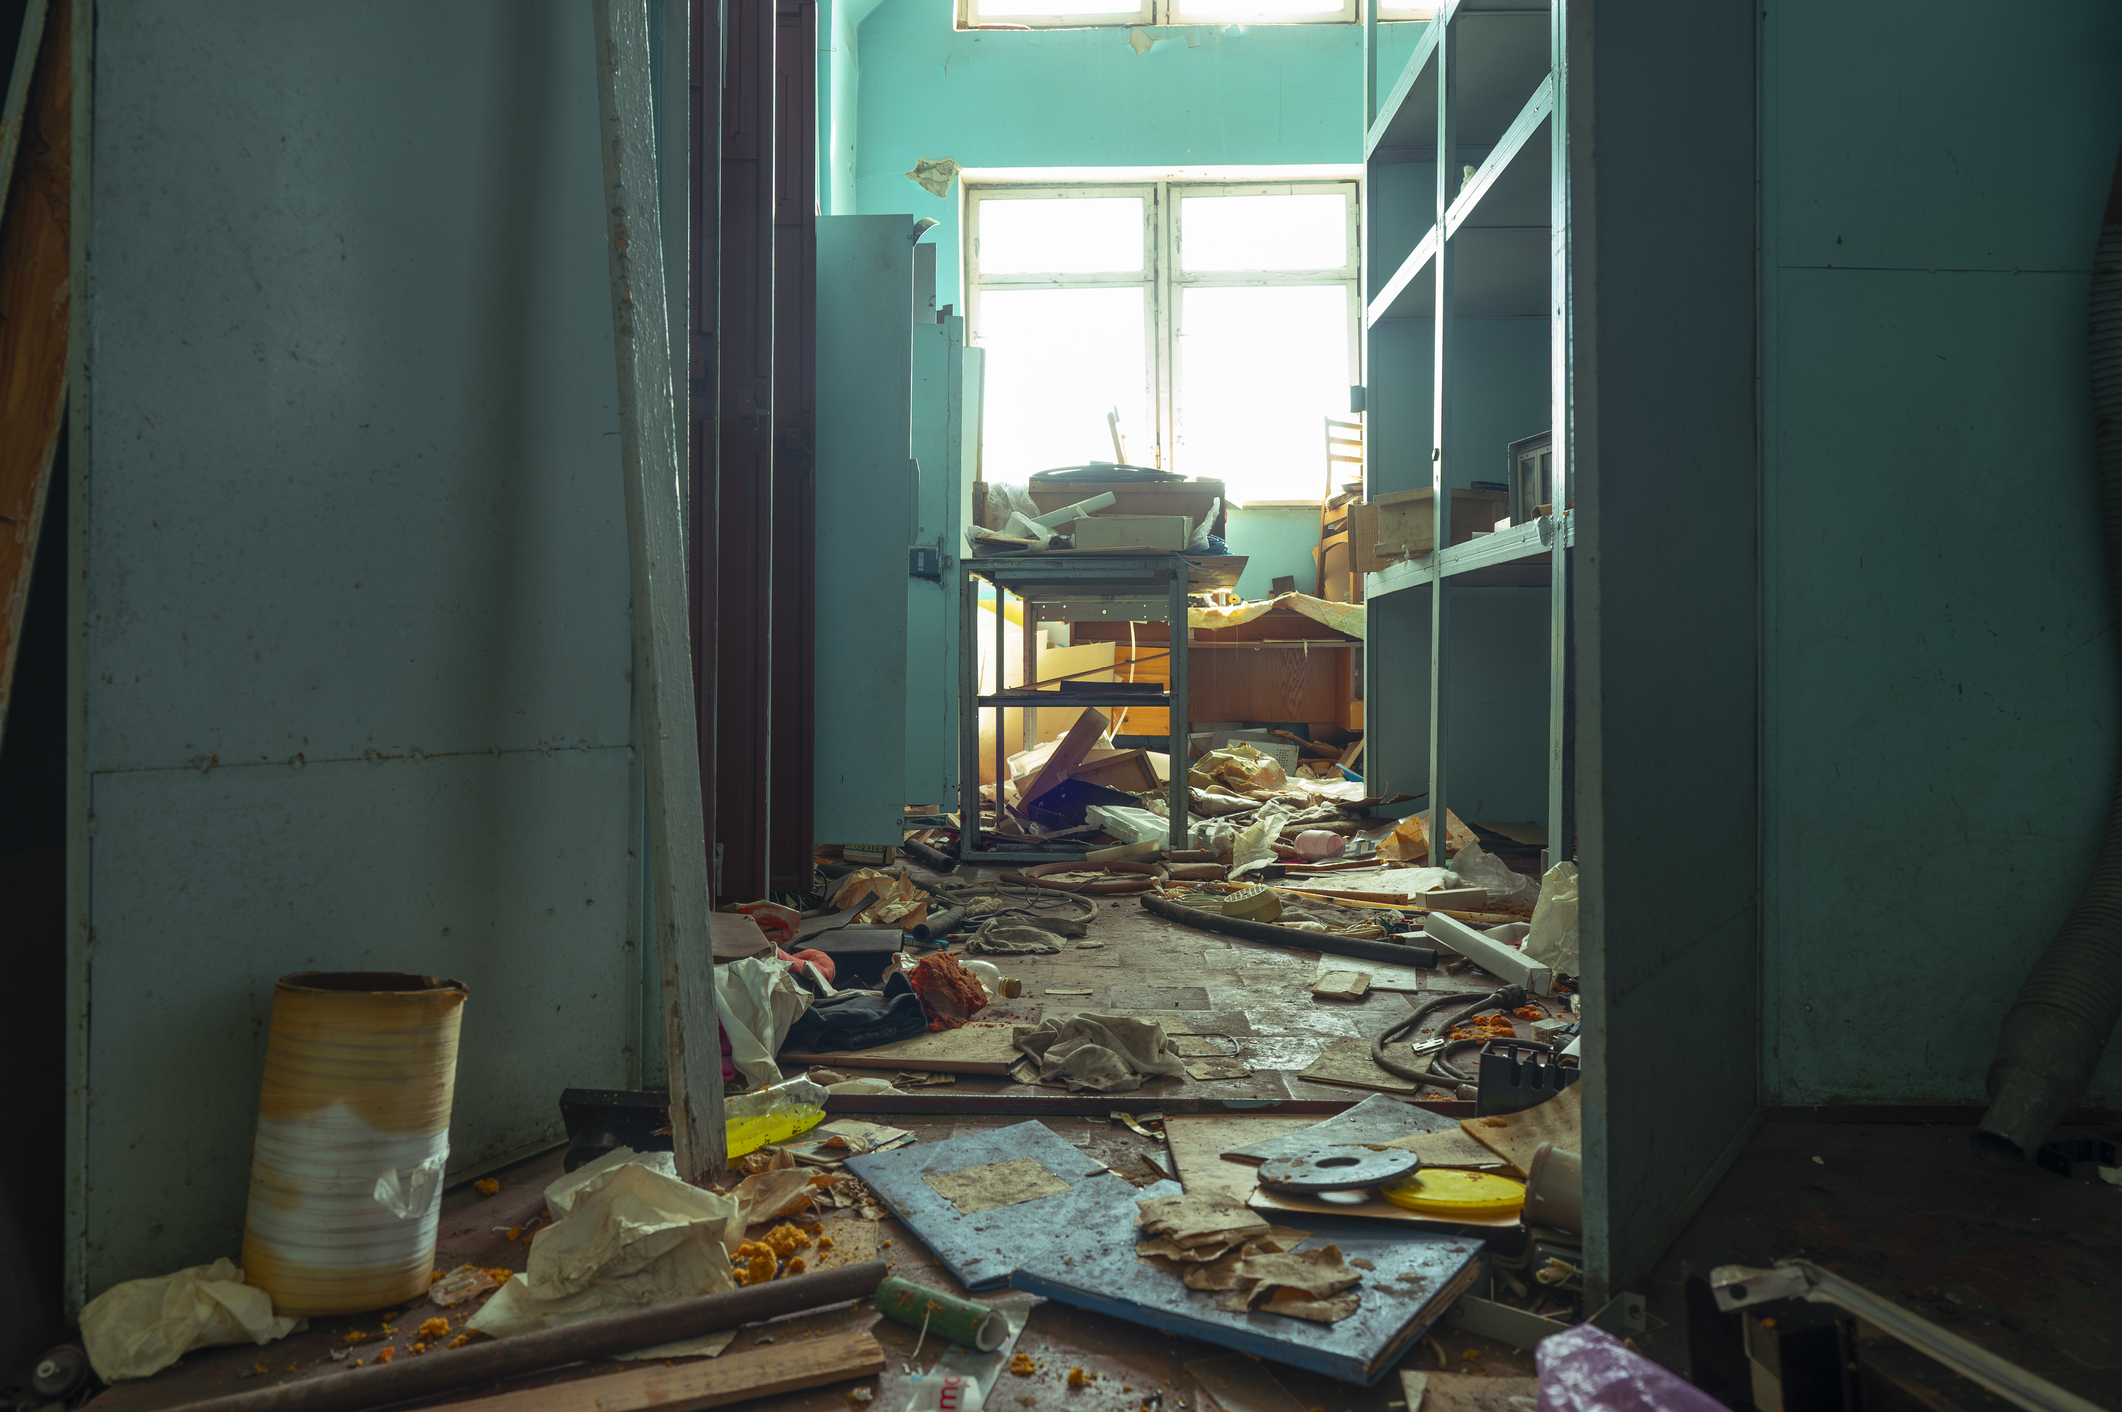
Vacant homes often carry more risk than meets the eye. From burst pipes and property theft to liability and squatter intrusion, a home left unoccupied for an extended period is exposed to a unique set of hazards, many of which may not be covered by a standard homeowners’ insurance policy.
Consider a recent case involving a homeowner who inherited a family property located several states away. With plans to sell the home, they left it unoccupied while it sat on the market through the winter months. After more than 60 days without a visit, the homeowner returned to find a devastating scene: a pipe had burst during a hard freeze, flooding much of the house.
Without anyone home to detect the issue, water had leaked for days — possibly weeks —causing severe damage to ceilings, walls, flooring, heating and electrical systems. The estimated cost of repairs exceeded $60,000.
Unfortunately, their standard homeowners insurance policy excluded coverage due to a vacancy clause, which had been triggered by the home’s unoccupied status.
Understanding Vacancy Clauses
Most homeowners insurance policies include a vacancy clause, which limits or excludes coverage if the property is unoccupied for typically 30 to 60 consecutive days. This is because vacant properties present heightened risks, including:
Undetected water leaks or burst pipes;
Increased likelihood of theft, vandalism, or trespassing;
Greater exposure to fire damage or electrical deficiencies; and
Liability if someone is injured on the property.
If a home will be vacant for an extended period, whether due to a sale, relocation, inheritance, or renovation, it’s essential to inform your insurance carrier and review your coverage options.
Water damage is one of the most common and expensive issues in unoccupied homes. Repairing damage from a burst pipe can cost $10,000 to $70,000 or more, depending on how long the issue goes unnoticed. In vacant homes, where regular checks are infrequent, leaks can continue for extended periods before detection, significantly increasing repair and remediation costs.
Vacant properties also are more susceptible to theft and unauthorized occupancy. Copper piping, appliances, and even fixtures can be attractive to criminals. Squatters present another challenge: in some jurisdictions, they can gain tenant rights if not removed promptly, leading to legal costs and delays.
Many standard policies exclude or limit coverage for theft and vandalism once a home is deemed vacant. This makes proper coverage even more important for homeowners who leave properties unoccupied, even temporarily.
Homeowners may be surprised to learn that liability exposure continues even when no one lives there. Injuries on vacant property can lead to significant financial losses.
Common examples include:
A delivery person slips on an icy walkway and seeks damages;
A contractor or realtor trips and is injured during a property showing; or
A child enters the home and is hurt while exploring.
In such cases, the homeowner may be held liable, and, if the home is classified as vacant under the policy, liability coverage could be denied. Legal expenses and settlements can easily run into six figures.
Vacancy endorsements are available
To manage the elevated risks of a vacant property, insurers offer vacant home insurance policies or vacancy endorsements. These policies are designed to cover unoccupied properties and typically include:
Water damage from plumbing or heating failures;
Fire, lightning, windstorm, and hail damage;
Theft, vandalism, and damage caused by trespassers; and
Coverage for legal liability in the event of injury on the property.
While these policies tend to be more expensive than standard homeowners insurance, they provide critical protection.
Vacant home policies often still include protection for “sudden and accidental” events, such as a pipe bursting due to freezing temperatures. However, insurers typically require proof that reasonable steps were taken to maintain the property. Failing to heat the home during the winter, for example, could void coverage even under a vacant home policy.
Whether a home is vacant for weeks or months, the following steps can help reduce your exposure:
Maintain indoor heat: Keep the thermostat at least 55°F during winter months.
Shut off the water supply: Or fully winterize the plumbing system.
Secure all entry points: Lock doors and windows; consider reinforced locks.
Install remote monitoring systems: Leak detectors, thermostats, and cameras can provide early warnings.
Schedule regular visits: Have a neighbor, family member, or property manager check the home weekly.
Maintain walkways and lighting: Reduce the risk of slip-and-fall injuries with proper upkeep.
Communicate with insurer: Always notify an insurer if the home will be unoccupied for an extended period.
Leaving a home unoccupied for months without adjusting your insurance coverage can expose you to significant financial risk. From costly repairs and legal liability to denied claims, the consequences can be catastrophic.
Before leaving a property vacant, whether due to sale, inheritance, or temporary relocation, homeowners should consult their insurance agent to identify the appropriate coverage. Obtaining a vacant home insurance policy or endorsement can protect both the property and the homeowner’s financial security.
By Loretta L. Worters, Vice President, Media Relations, Triple-I
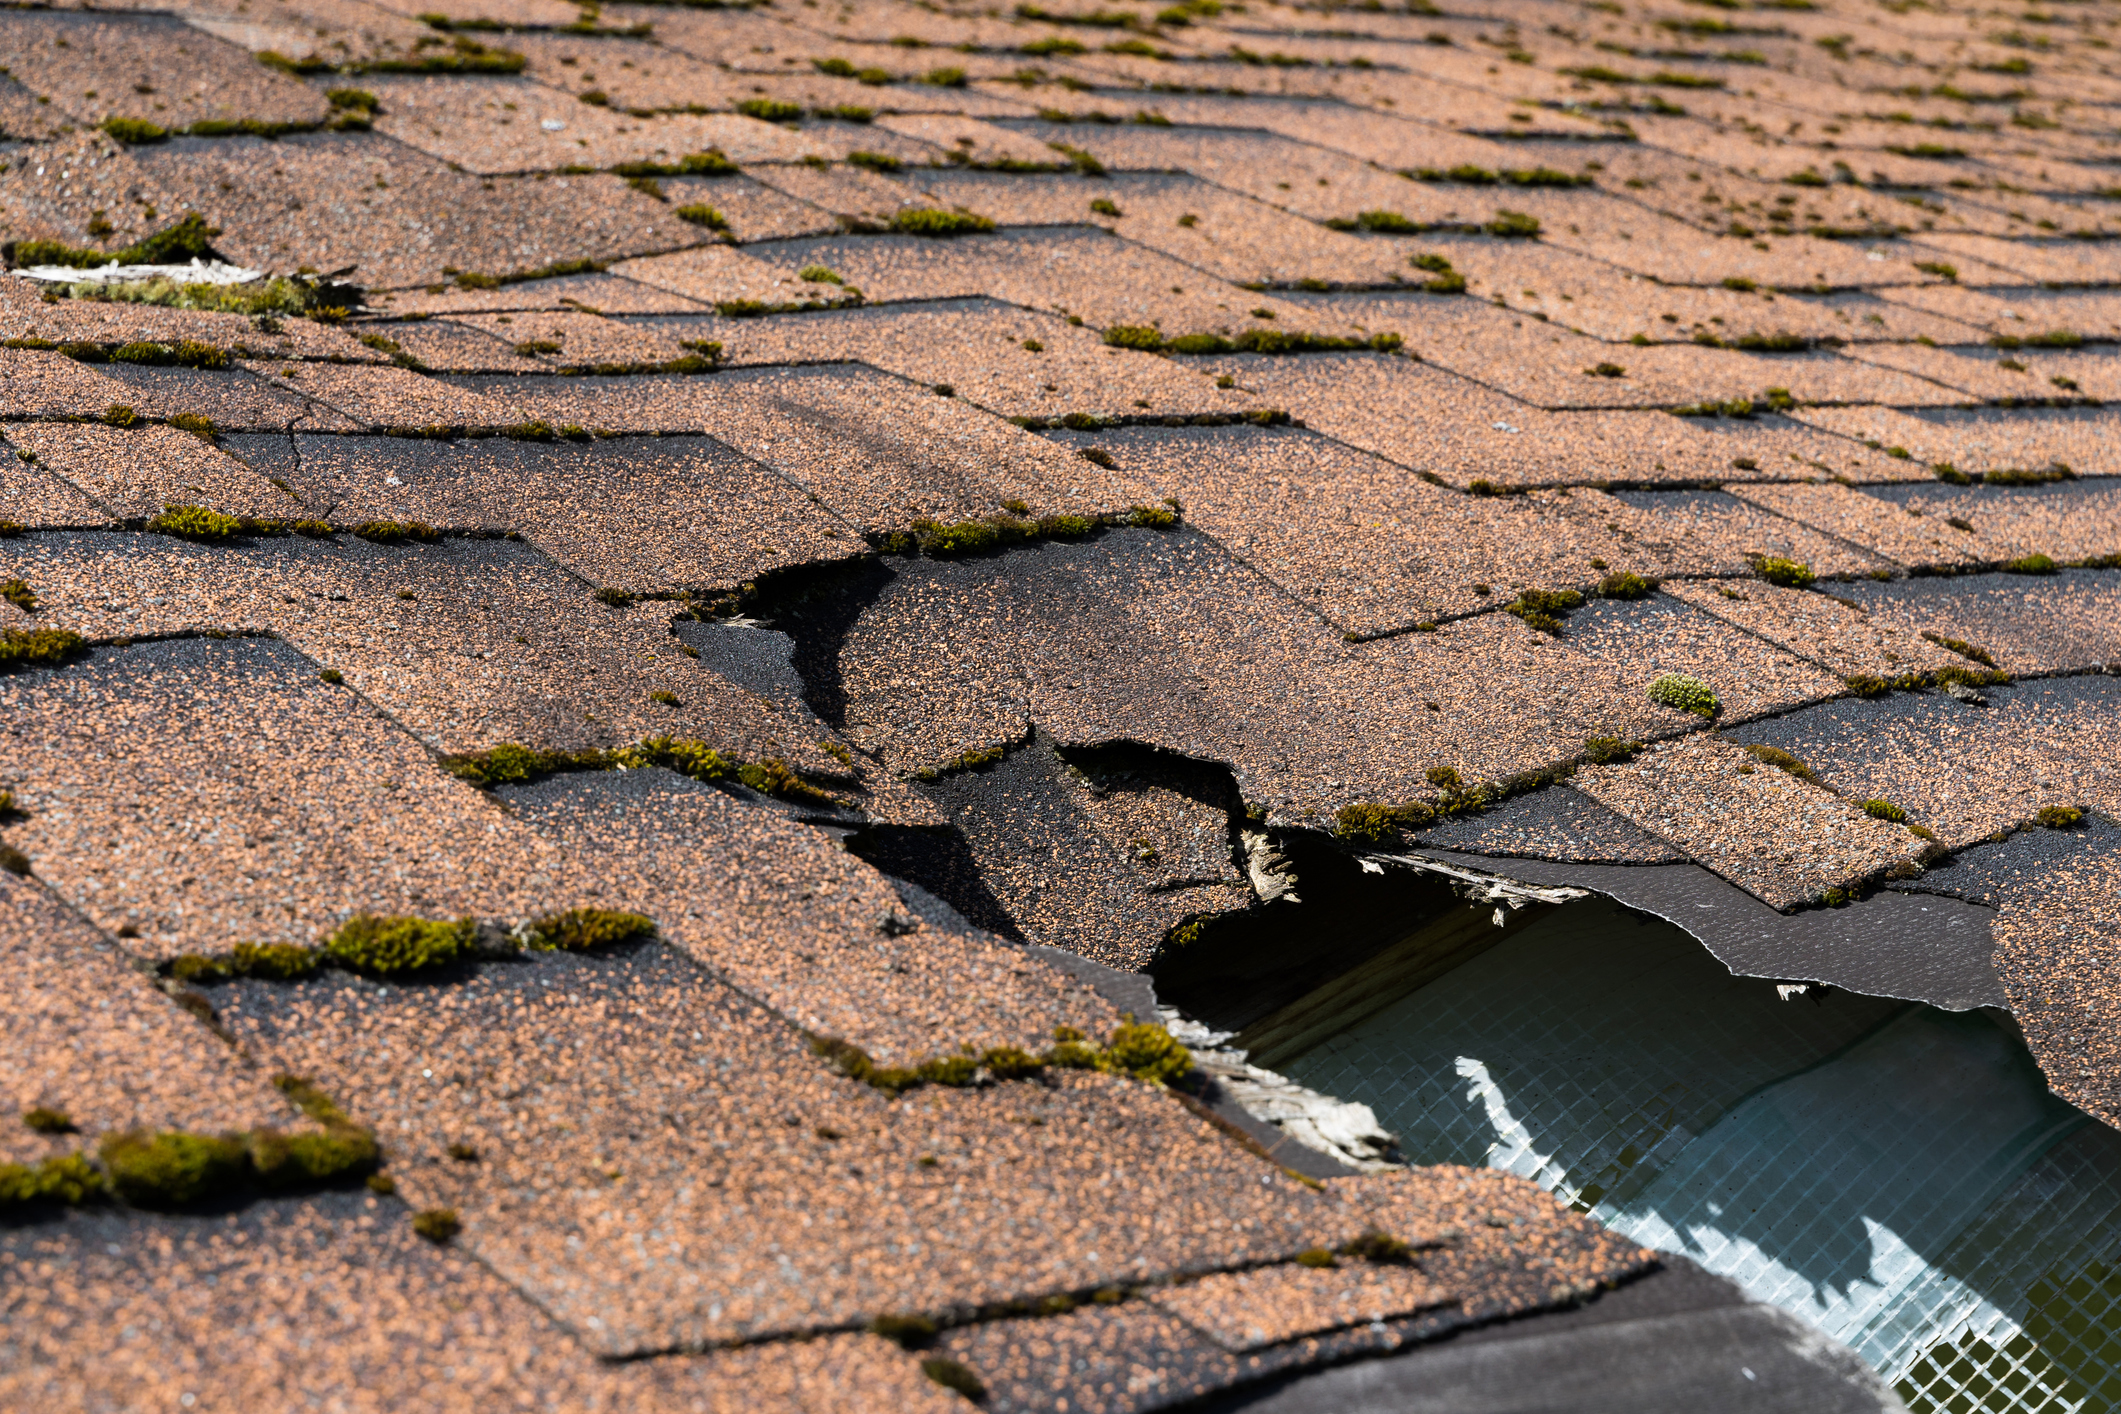
Your roof is more than just a covering over your head. It’s the first line of defense against nature’s most powerful forces.
During National Roof Awareness Week (June 1-7), we spotlight the critical role roofs play in protecting homes, businesses, and communities from severe weather (see infographic) and why building stronger, smarter roofs today is essential for reducing damage and insurance claims tomorrow.
Why roof awareness matters
The roof bears the brunt of wind, rain, hail, fire, and flying debris. Yet, many home and business owners overlook its condition until it’s too late. According to the Insurance Institute for Business & Home Safety (IBHS), a staggering 70 to 90 percent of storm-related insurance claims involve roof damage. Whether it’s shingle loss from 60 mph winds or water intrusion through exposed decking, roof failures can turn a storm into a financial disaster.
FORTIFIED: A better way to build and rebuild
Developed by IBHS after decades of research, the FORTIFIEDstandard is a voluntary construction and re-roofing method that dramatically improves a building’s ability to withstand severe weather. FORTIFIED Roof™ strengthens the most vulnerable parts of a roof, such as edges, decking, and fastening systems, through methods like:
Using sealed roof decks to prevent water intrusion (can reduce damage by up to 95 percent);
Requiring ring-shank nails to secure roof decking more effectively; and
Reinforcing edges with fully adhered starter strips and a wider drip edge.
Many upgrades are affordable. A sealed roof deck can cost as little as $600, and switching to stronger nails might cost under $100 for a typical 2,000-square-foot home. Roofs built to the FORTIFIED standard not only protect what matters most; it can also lead to significant insurance discounts in states like Alabama, Oklahoma, and Mississippi. These programs are making roof resilience accessible and cost-effective for homeowners and businesses alike.
“It only takes one storm to turn a minor vulnerability into major destruction,” said Roy Wright, IBHS president and CEO. “At IBHS, we’ve spent decades studying how buildings fail—and how they survive. That research led to the FORTIFIED Roof standard, a proven way to reduce storm damage. It’s affordable, accessible, and one of the smartest investments a homeowner can make for peace of mind and protection.”
Why It Matters to Insurers
Insurers are increasingly focused on roof resilience because it reduces the number and severity of claims. The FORTIFIED Roof standard is part of a broader industry shift from “detect and repair” to “predict and prevent.”
Poorly maintained or outdated roofs can result in denied claims, higher premiums, or non-renewal of policies. Conversely, resilient roofs may qualify for preferred coverage, lower deductibles, and better insurance options.
“A resilient roof isn’t just a safeguard for a single structure,” said Triple-I CEO Sean Kevelighan. “It’s a smart strategy for reducing risk across entire communities. As frequency and severity of natural disasters rise, insurers are increasingly focused on proactive solutions like the FORTIFIED standard. These improvements help protect property, minimize costly disruptions, and ensure insurance remains available and affordable for more Americans.”
Roofing in wildfire and hurricane zones
Roofs are also vulnerable to wildfire embers, especially in areas where debris can ignite on the roof surface. For wildfire-prone regions, following IBHS’s Wildfire Prepared Home standard and local fire-safe roofing recommendations is critical. Likewise, in hurricane zones, strong connections between roof components can prevent catastrophic failures when wind forces attempt to peel roof decks away.
Replacing or upgrading a roof is one of the most important investments you can make to your property. And thanks to resources like the Roofing Roadmaps from IBHS, homeowners and business owners can make informed decisions about materials, maintenance, and upgrades that will pay off in both resilience and reduced risk.
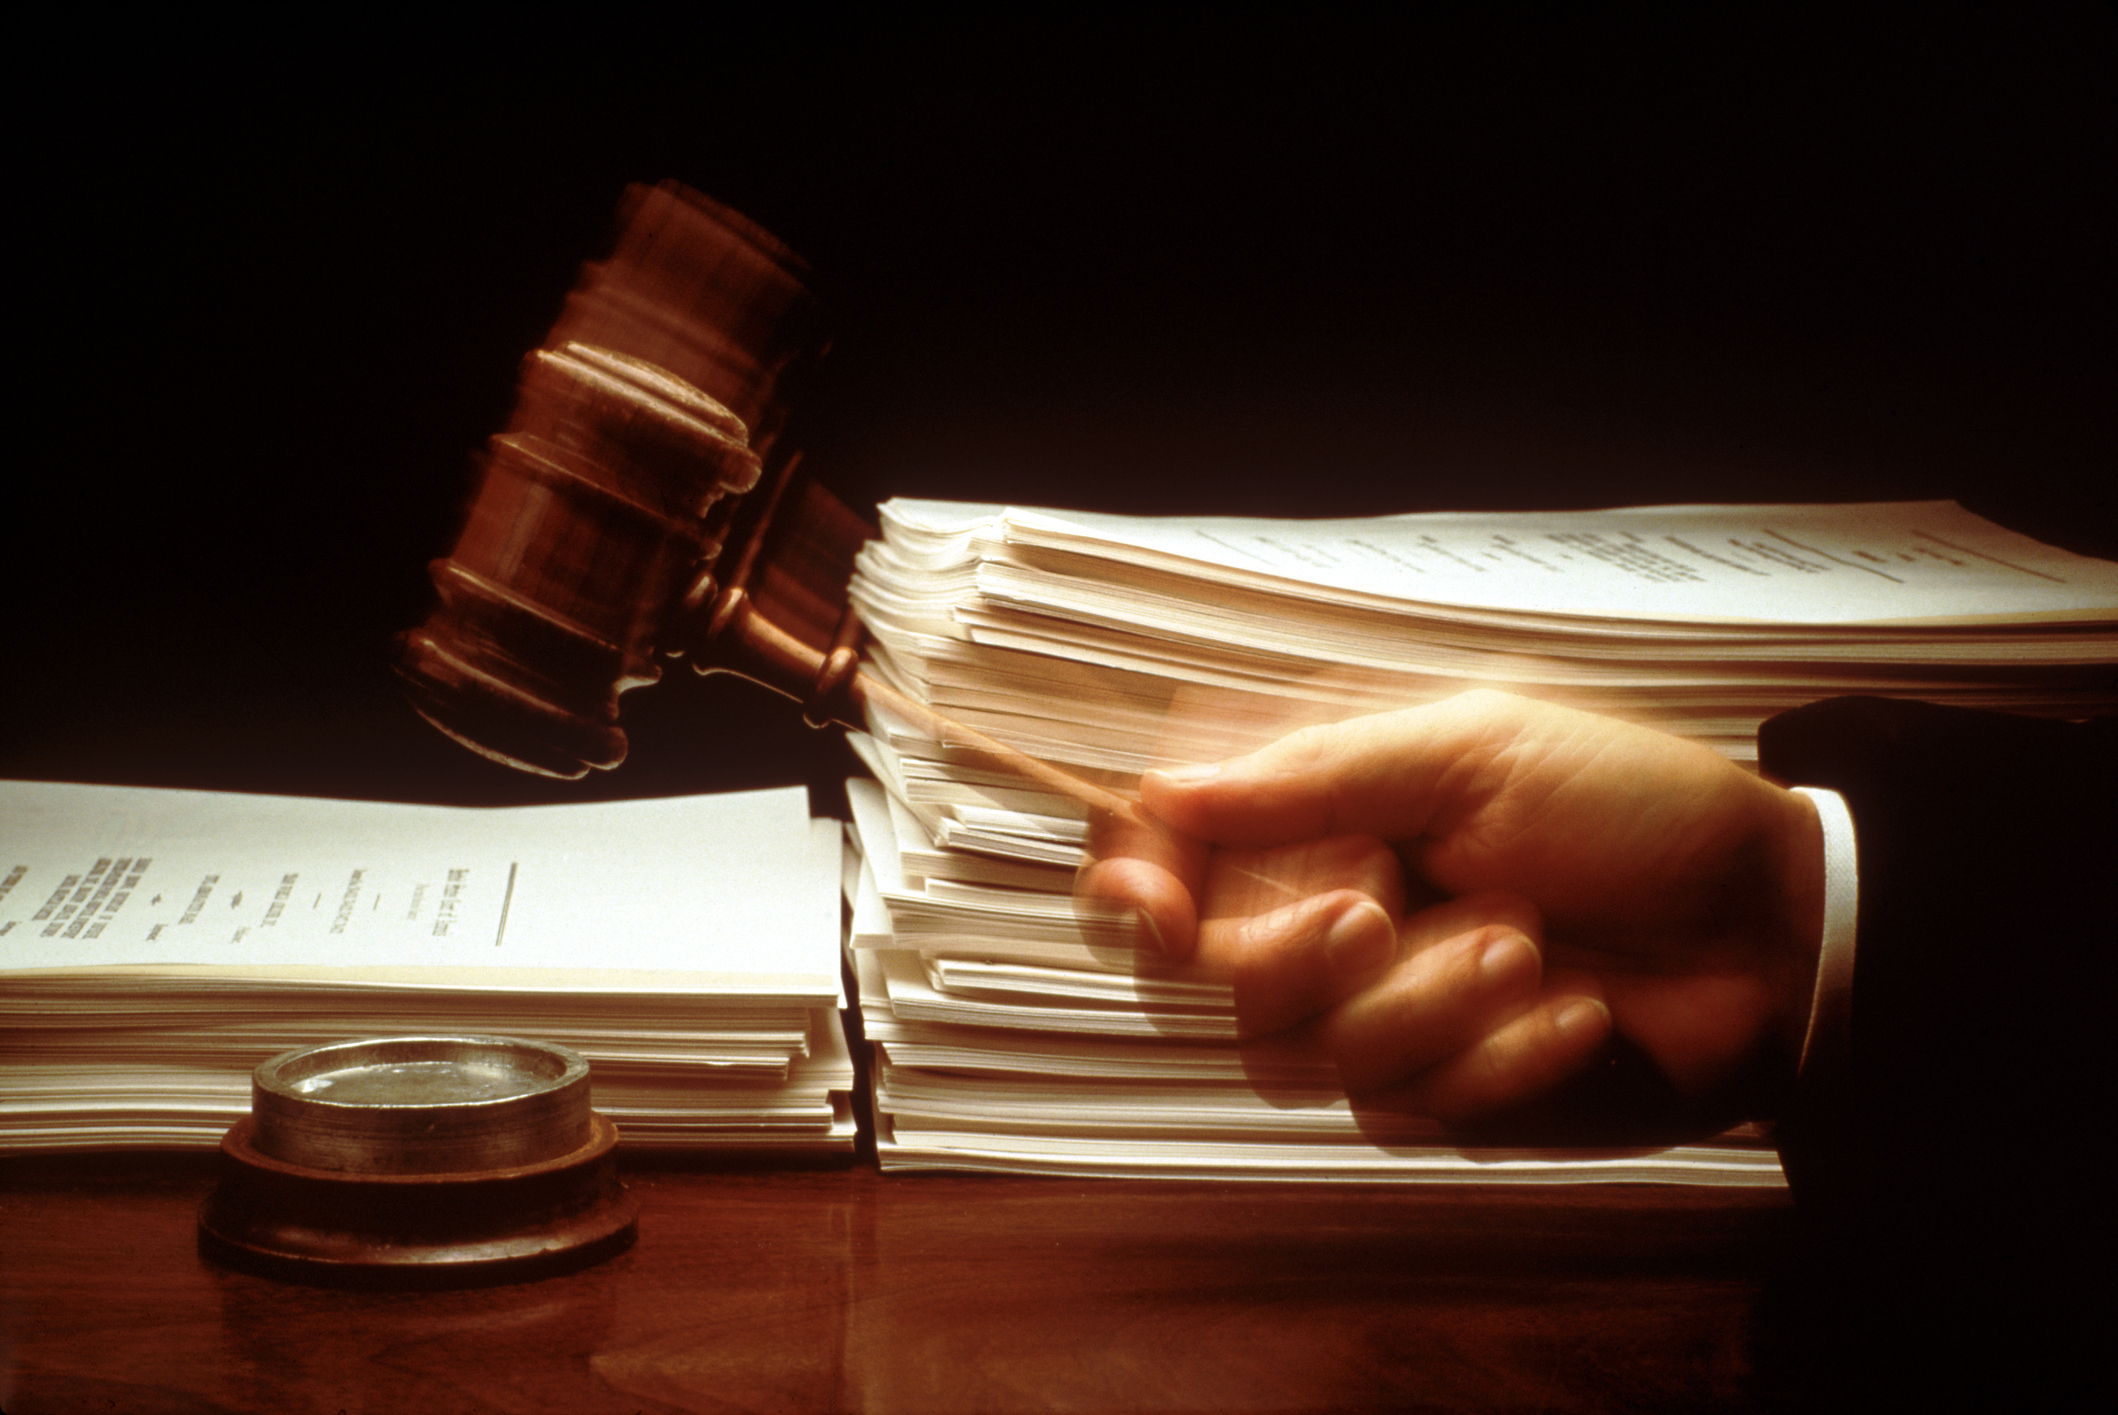
Advertising is one of the most common methods companies use to sell their products and services and influence public perceptions. While the issue brief doesn’t argue that general advertising or filing for due process is problematic, it does offer a risk management-based lens for viewing how aggressive attorney advertising campaigns can fuel costs associated with settling claims.
Key Findings
Legal service providers spent $2.5 billion on 26.9 million ads across the United States.
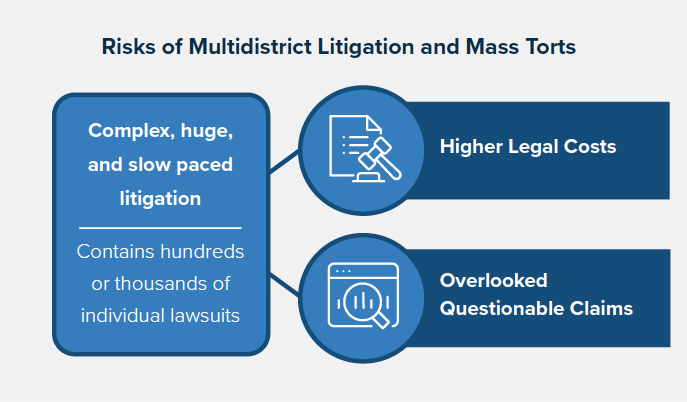
Research suggests that legal advertising increases the number of plaintiffs in multidistrict litigation (MDL), which are large lawsuits consisting of multiple civil cases involving one or more common questions of fact but pending in different districts.
Product liability cases, which accounted for 38 percent of pending MDLs as of August 2023, emerged as the single largest category of MDLs, while other case types have decreased from 2012 to 2022.
The third-party litigation funding market, with an estimated size of $16 billion, is a likely resource for advertising budgets for mass torts; however, 12 states and two jurisdictions have enacted or are considering disclosure requirements.
Ads for legal services and lawsuits saturate all channels of communication – public billboards, radio and television broadcasts, and social media – dangling the lure of a financial windfall. Legal services marketing isn’t uniquely used for mass litigation cases. Nonetheless, it is overall geared to recruit as many lawsuit filers as possible. Therefore, aggressive advertising for legal services introduces the risk of fueling higher claim costs via problematic litigation.
These advertisements often employ an exaggerated sense of urgency, urging the target audience to take immediate legal action without considering alternative options for resolution. These ads may also often overpromise results by implying guaranteed windfalls (i.e., “We’ll get you your money’’), creating unrealistic expectations for plaintiffs and, thus, potentially impacting the time to settle. Additionally, when ads mention a particular product or brand, attorneys communicate plaintiff-biased information to potential jurors. In essence, a juror may recall seeing a flood of advertisements about the product and think, “Where there’s smoke, there must be fire.”
The brief focuses on MDLs because these are complex, huge, and slow-paced cases that may sometimes involve hundreds, even thousands of individual lawsuits. Therefore, these cases inherently carry the risk of driving up legal costs. Also, the large number of plaintiffs introduces the risk that questionable claims might slip into the lawsuit. For example, a particular product may have indeed caused harm to some, but not all, of the plaintiffs who used it.
Pummeling the world with ads can be expensive. Enter the third-party litigation funding (TPLF) market, which, despite tighter capital controls in recent years, grew to $16 billion in 2024, up from $15.2 billion in 2023. TPLF offers discretionary funding to the litigation industry, which can, in turn, use the money to fuel more lawsuits seeking large settlements — a boon for the firms and the funder. The brief outlines how several states and jurisdictions are moving to create transparency around TPLF involvement.
Practices that foster unnecessary or drawn-out litigation are among several hard-to-measure forces that can shift loss ratios for insurers and disrupt forecasts, making cost management more challenging. Ultimately, the cost is passed on to consumers, adversely impacting coverage affordability and availability. Triple-I is committed to advancing conversations with business leaders, government regulators, consumers, and other stakeholders to attack the risk crisis and chart a path forward.
Read the issue brief to find out more about how attorney advertising can contribute to legal system abuse. To join the discussion, register for JIF 2025. Follow our blog to learn more about trends in insurance affordability and availability across the property/casualty market.
A study by the Alabama Department of Insurance, in collaboration with the University of Alabama Center for Insurance Information and Research, shows that widespread adoption of IBHS FORTIFIED construction standards could dramatically reduce insurance claims from hurricanes, while also encouraging property/casualty insurers to maintain coverage in high-risk areas.
Homes built or retrofitted to FORTIFIED standards from the Insurance Institute for Business & Home Safety were found to have suffered far less property damage and a lower volume of insurance claims from Hurricane Sally — which made landfall in Gulf Shores, Alabama, as a Category 2 storm in September 2020 — than non-FORTIFIED properties.
“The results show mitigation works and that we can build things that are resilient to climate change,” said the author of the study, Triple-I non-resident scholar Lars Powell.
A collective effort
Alabama’s proactive approach – which includes mandatory insurance discounts and a state-backed grant program for resilient construction – offers a model for risk mitigation and protecting homeowners from catastrophic winds of tropical cyclones.
“Alabama was an early adopter of FORTIFIED designations for wind loss mitigation,” the report says. “In 2025, there are more than 53,000 FORTIFIED houses in the state,” out of approximately 80,000 nationwide.
The state grants and insurance discounts have been a big motivator for homeowners to make the investment. Lawmakers in other hurricane-prone states, such as Louisiana, are looking to Alabama’s strategy as they seek solutions for predicting and preventing losses from increasing natural disaster risks.
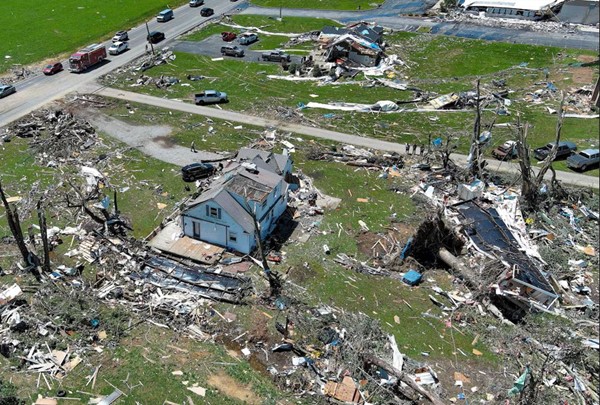
Tornado activity in 2025 has surged, with more than 1,000 reported tornadoes as of May 28 and outbreaks spreading across nearly every state east of the Rockies this season, according to according to the NOAA Storm Prediction Center.
Researchers have highlighted a shift in both the timing and geography of tornadoes, raising new safety concerns for communities outside the traditional Tornado Alley states. The widening prevalence of tornado activity has some experts suggesting that the name “Tornado Alley” be retired.
The 1,010 tornadoesreported is almost 40 percent higher than the 15-year average of 727 tornadoes for the same period. Mississippi leads with 97 tornado reports, followed by Illinois (93), Missouri (89), and Texas (87), according to AccuWeather.
Severe convective storms – which include tornadoes – are among the most common, most damaging natural catastrophes in the United States. The result of warm, moist air rising from the earth, they manifest in various ways, depending on atmospheric conditions – from drenching thunderstorms with lightning, to tornadoes, hail, or destructive straight-line winds.
In 2024, according to Gallagher Re, the economic cost solely from weather and climate events was approximately $402 billion ($151 billion insured). At least 41 percent of insured losses ($64 billion) resulted from severe convective storms.
So far this year, Gallagher said, the United States has recorded at least eight separate billion-dollar insured loss events from SCS activity so far in 2025. This compares to 13 such events by the end of May in 2024, 11 in 2023, six in both 2022 and 2021, and 12 in 2020.
In addition to tornadoes, Gallagher said, large hail – measuring two inches or more in diameter – was a major factor in driving losses.
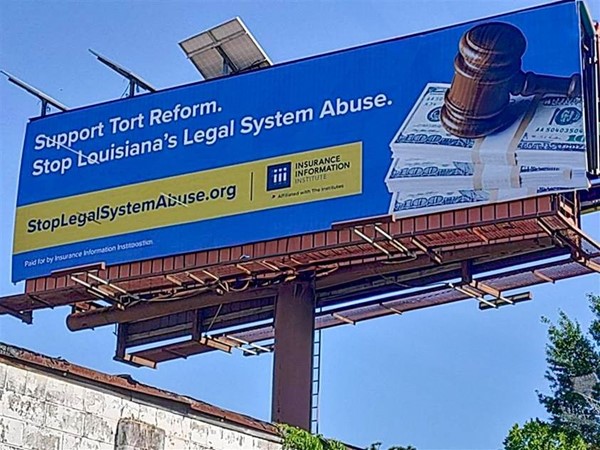
Louisiana’s Senate passed five tort reform bills last week to curb legal system abuse driven by billboard attorneys in the Pelican State. The legislative success represents the culmination of sustained advocacy efforts – including a Triple-I-backed awareness campaign, StopLegalSystemAbuse.org – to build public support.
The new legislation addresses Louisiana’s longstanding challenges with high insurance premiums and the state’s reputation for being plaintiff-friendly in civil litigation. The reforms include stricter limits on damages, clearer standards for expert testimony, and other procedural changes designed to restore balance to the courts while reducing financial burdens on Louisiana families and businesses.
However, an additional measure intended to change state regulations for approving rate filings for auto and home insurance overshadowed the positive actions taken by lawmakers, the Times-Picayune reported.
House Bill 431, which would prevent drivers who are at least 51 percent at fault in an accident from receiving any compensation for their own injuries, requires final House approval due to Senate amendments. So do Senate Bill 231, which would allow insurers’ lawyers to present jurors with the actual amount paid for medical bills, rather than the total billed, and House Bill 436, which would ban undocumented immigrants injured in car accidents from receiving general (non-economic) damages.
House Bill 434, which would increase the threshold from $15,000 to $100,000 for uninsured drivers to collect medical expenses for bodily injuries in accidents, and House Bill 450, which would require plaintiffs in car accident lawsuits to prove their injuries were actually caused by the accident, are awaiting Gov. Jeff Landry’s signature.
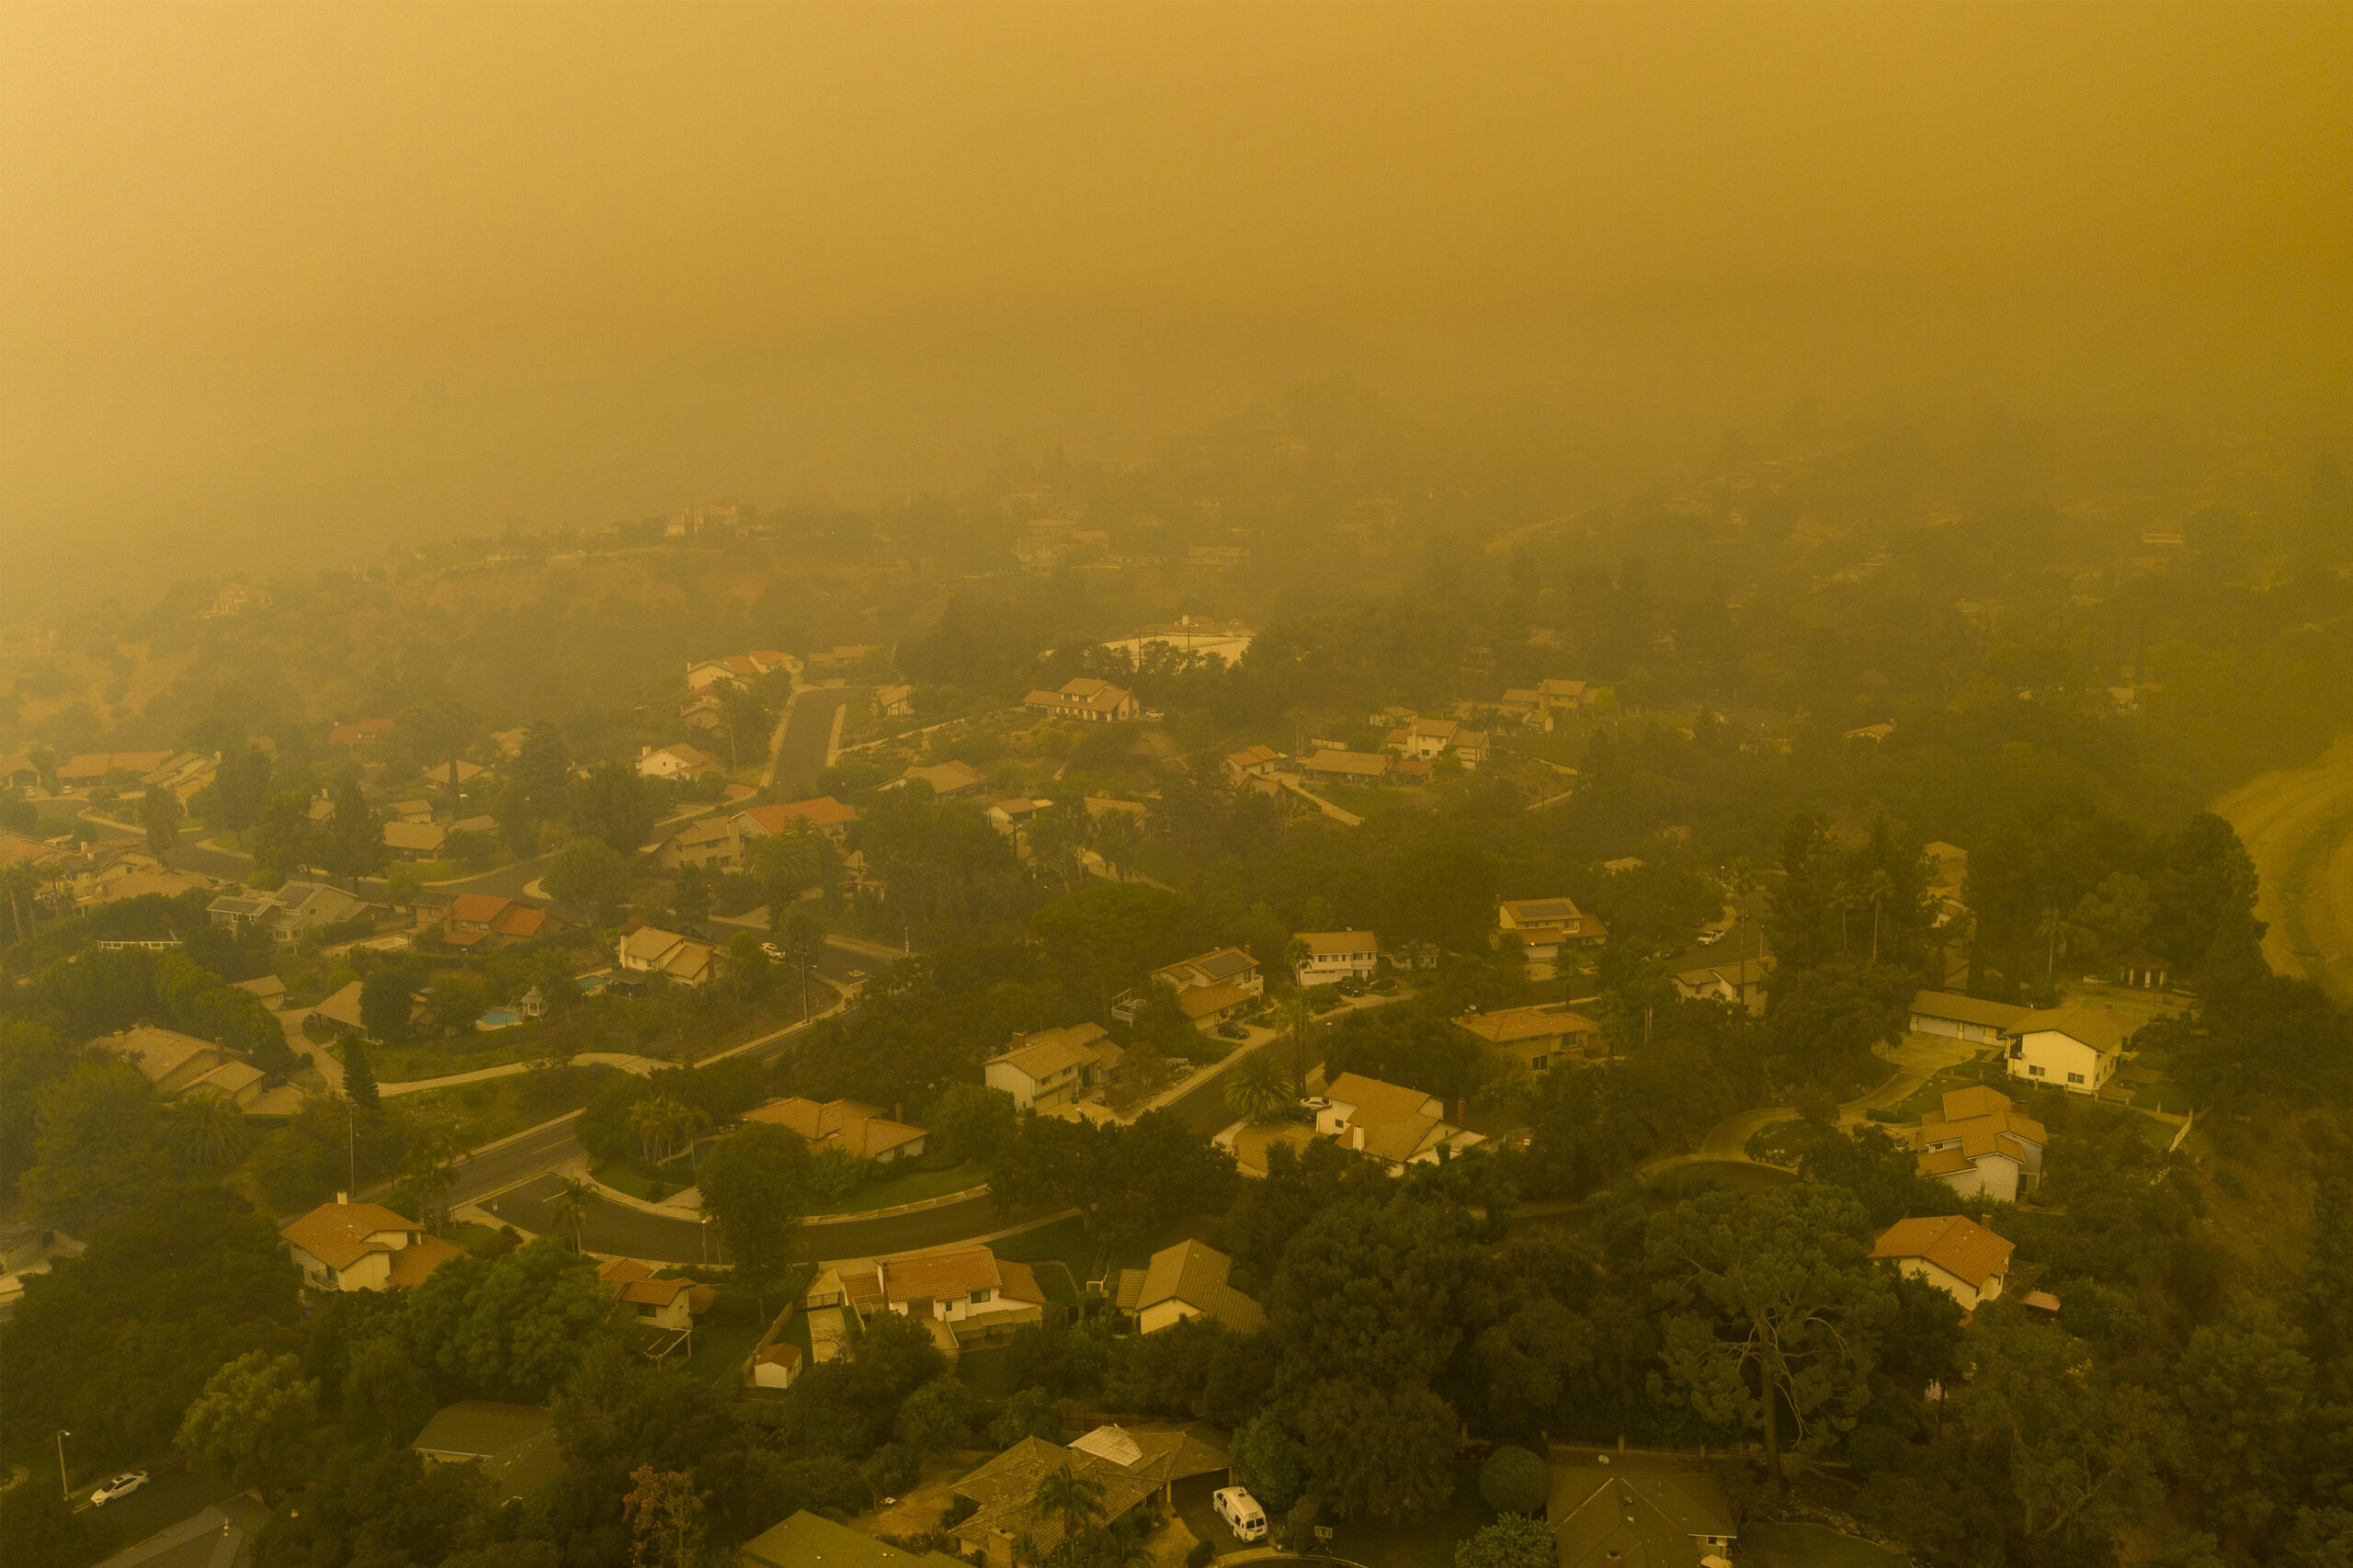
Two lawsuits filed in Los Angeles claim major California insurers colluded illegally to impede coverage in wildfire-prone areas, forcing homeowners into the state’s last-resort FAIR Plan. Accusing carriers of violating antitrust and unfair competition laws, the two suits exemplify an ongoing disconnect between public and insurer perceptions of insurance market dynamics, exacerbated by legislators’ resistance to accommodating the state’s evolving risk profile.
An untenable situation
Both suits claim the insurers conspired to “suddenly and simultaneously” drop existing policies and cease writing new ones in high-risk communities, deliberately pushing consumers into the FAIR Plan. Left underinsured by the FAIR Plan, the plaintiffs argue they were wrongfully denied “coverage that they were ready, willing, and able to purchase to ensure that they could recover after a disaster,” Michael J. Bidart, who represents homeowners in one of the cases, said in a statement.
Established in response to the 1965 Watts Rebellion, the California FAIR Plan provides an insurance option for homeowners unable to purchase from the traditional market. Though FAIR Plans offer less coverage for a higher premium, they cover properties where insurance protection would otherwise not exist. California law requires licensed property insurers to contribute to the FAIR Plan insurance pool to conduct any business within the state, meaning they share the risks associated with those properties.
Intended as a temporary solution until homeowners can secure policies elsewhere, the FAIR Plan has become overwhelmed in recent years as more insurers pull back from the market. As of December 2024, the FAIR plan’s exposure was $529 billion – a 15 percent increase since September 2024 (the prior fiscal year end) and a 217 percent increase since fiscal year end 2021. In 2025, that exposure will increase further as FAIR begins offering higher commercial coverage for farmers, homebuilders, and other business owners.
With a policyholder count that has more than doubled since 2020, the FAIR Plan faces an estimated $4 billion total loss from the January fires alone.
Out of touch regulations
Homeowners are understandably frustrated with dwindling coverage availability, which currently afflicts many other disaster-prone states. Supply-chain and inflationary pressures, which could intensify under oncoming U.S. tariff policies, help fuel the crisis. But California’s problems stem largely from an antiquated regulatory measure that severely constrains insurers’ ability to manage and price risk effectively.
Despite a global rise in natural catastrophe frequency and severity, regulators have applied the 1988 measure, Proposition 103, in ways that bar insurers from using advanced modeling technologies to price prospectively, requiring them to price based only on historical data. It also blocks insurers from incorporating reinsurance costs into their prices, forcing them to pay for these costs from policyholder surplus and/or reduce their presence in the state.
Insurers must adjust their risk appetite to reflect these constraints, as they cannot profitably underwrite otherwise. Underwriting profitability is essential to maintain policyholder surplus. Regulators require insurers to maintain policyholder surplus at levels that ensure that every policyholder is adequately protected.
Restricting insurers’ use of prospective data, however, inhibits risk-based pricing and weakens policyholder surplus, facilitating policy nonrenewals and, in serious cases, insolvencies.
Insurance Commissioner Ricardo Lara implemented a Sustainable Insurance Strategy to mitigate these trends, including a new measure that authorizes insurers to use catastrophe modeling if they agree to offer coverage in wildfire-prone areas. The strategy has garnered criticism from legislators and consumer groups, one of whom is suing Lara and the California Department of Insurance over a 2024 policy aimed at expediting insurance market recovery after an extreme disaster.
“Insurers are committed to helping Californians recover and rebuild from the devastating Southern California wildfires,” Denni Ritter, the American Property Casualty Insurance Association’s department vice president for state government relations, said in a statement about the suit. “Insurers have already paid tens of billions in claims and contributed more than $500 million to support the FAIR Plan’s solvency – even though they do not collect premiums from FAIR Plan policyholders.”
A call for collective action
Litigation prolongs – it does not alleviate – California’s risk crisis. Government has a crucial role to play in addressing it, from adopting smarter land-use planning regulations to investing in long-term resilience solutions.
For instance, Dixon Trail, a San Diego County subdivision dubbed the country’s first “wildfire resilient neighborhood,” models the Insurance Institute for Business & Home Safety (IBHS) standards for wildfire preparedness, but not at a cost attainable to most communities, and few local governments incentivize them. Launched by state legislature in 2019, the California Wildfire Mitigation Program is on track to retrofit some 2,000 houses along these guidelines, with the goal of solving how to fortify homes more quickly and inexpensively. Funded primarily by FEMA’s Hazard Mitigation Assistance Grant program, the pilot has thus far avoided the same cuts befalling FEMA’s sister programs under the Trump Administration.
Regardless of what legislators do, California homeowners’ insurance premiums will need to rise. The state’s current home and auto rates are below average as a percentage of median household income, reflecting a combination of the increased climate risk and of the regulatory limitations preventing insurers from setting actuarially sound rates. Insurance availability will not improve if these rates persist.
To quote Gabriel Sanchez, spokesperson for the state’s Department of Insurance: “Californians deserve a system that works – one where decisions are made openly, rates reflect real risk, and no one is left without options.” Insurers do not wield absolute control over that system, and neither do legislators, regulators, consumer advocates, or any other singular group. Confronting the root causes of these issues – i.e., the risks – rather than the symptoms is the only path towards systemic change.


