

By William Nibbelin, Senior Research Actuary, Triple-I
Insurance is priced to reflect the underlying risk of every policy. When more claims are filed and the average amount paid of those claims increases, insurance becomes more expensive. A measure of underwriting profitability for insurance carriers is the combined ratio calculated as losses and expense divided by earned premium plus operating expenses divided by written premium. A combined ratio over 100 represents an underwriting loss. When expected losses increase, an insurance carrier must increase premiums by raising rates to maintain a combined ratio under 100.
Commercial auto insurance has recorded a net combined ratio over 100 nine times out of 10 between 2014 and 2023, and, according to the latest forecasting report by Triple-I and Milliman, continues to worsen in 2024. According to the Triple-I Issues Brief, personal auto insurance has had a net combined ratio over 100 for the past three years, with a 2023 net written premium (NWP) growth of 14.3 percent, which was the highest in over 15 years.
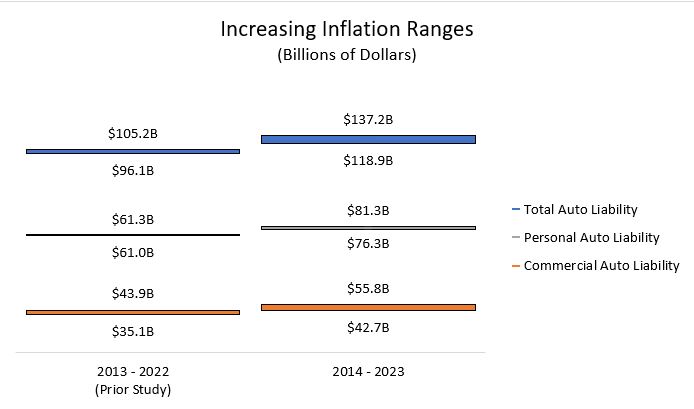
From 2014 through 2023 economic and social inflation added $118.9 billion to $137.2 billion in auto liability losses and defense and cost containment (DCC) expenses. This represents 9.9 percent to 11.5 percent of the $1.2 trillion in net losses and DCC for the period and an increase of 24 percent to 31 percent from the previous analysis on years 2013 through 2022.
A new study – “Increasing Inflation on Auto Liability Insurance – Impact as of Year-end 2023” – is the fourth installment of research on the impact of economic and social inflation on insurer costs and claim payouts. Compared to the prior study, Commercial Auto Liability loss and DCC is 20.7 percent to 27.0 percent ($43 billion to $56 billion) higher due to increasing inflation. Personal auto liability loss and DCC is 7.7 percent to 8.2 percent ($76 billion to $81 billion) higher from increasing inflation.
Key Takeaways
- The compound annual impact of increasing inflation ranges from 2.2 percent to 2.9 percent for commercial auto liability, which is higher than the personal auto liability estimate of 0.7 percent. However, the impact of increasing inflation from a dollar perspective is much higher for personal auto liability compared to commercial auto liability. This is due, in part, to the underlying size of the line of business.
- Frequency of auto liability claims per $100 million GDP for 2023 is unchanged for commercial auto liability and lower for personal auto liability compared to 2020, when frequency dropped at the onset of the COVID-19 pandemic for both lines.
- Severity of auto liability claims continues to increase year over year and has increased more than 70 percent from 2014 to 2023 for both lines.
Researchers Jim Lynch, FCAS, MAAA, Dave Moore, FCAS, MAAA, LLC, Dale Porfilio, FCAS, MAAA, Triple-I’s chief insurance officer, and William Nibbelin, Triple-I’s senior research actuary used a similar methodology as prior studies. Loss development patterns were used to identify inflation for selected property/casualty lines in excess of inflation in the overall economy. The new study extends the model with annual statement data through year-end 2023.
Commercial Auto Liability
The prior study indicated claim severity (size of losses) had risen 72 percent overall from 2013 to 2022, with the median annual increase at 6.3 percent. The new study indicates an additional annual increase of 6.6 percent from 2022 to 2023. The report compares the compound annual growth rate of 6.6 percent from 2014 through 2023 to the compound annual increase in the consumer price index (CPI) of 2.8 percent during this same time. With a flat frequency trend combined with an increasing severity trend in recent years for commercial auto liability, this comparison calls out the higher inflation faced by insurers beyond just general inflation trends.
Personal Auto Liability
While replacement costs remain flat to negative providing relief to personal auto physical damage, personal auto liability represents approximately 60 percent of the overall personal auto line. Similar to commercial auto liability – but slightly lower – claim severity for personal auto liability has increased at a compound annual rate of 6.3 percent from 2014 through 2023. However, unlike commercial auto liability, the frequency for personal auto liability has declined slightly in 2022 and 2023, with 85 claims per $100 million GDP in 2023 compared to 90 in 2022 and 100 in 2021.
Limitation of industry data
The report relies on industry data as reported by insurers to the National Association of Insurance Carriers (NAIC) and made available through different reporting suppliers, such as S&P Global Market Intelligence. As such, different individual inflationary elements – whether economic, social, or otherwise – cannot be determined using the underlying actuarial methodologies.
However, like prior studies the bulk of increasing inflation before 2020 is attributed to social inflation, while social inflation and economic inflation dominate increasing inflation together beginning in 2020.
Triple-I continues to foster a research-based conversation around social inflation as part of legal system abuse. For an overview of the topic and other helpful resources about its potential impact on insurers, policyholders, and the economy, check out our knowledge hub.