The U.S. property and casualty insurance industry experienced better-than-expected economic and underwriting results in the first half of 2024, according to the latest forecasting report by Triple-I and Milliman. The report was released during a members-only webinar on Oct. 10.
The industry’s estimated net combined ratio of 99.4 represented a 2.3-points year-over-year improvement, with commercial lines continuing to outperform personal lines. Combined ratio is a standard measure of underwriting profitability, in which a result below 100 represents a profit and one above 100 represents a loss.
Much of the overall underwriting gain was due to growth in personal lines net premiums written. Commercial lines underwriting profitability remained mostly flat.
“The ongoing performance gap between personal and commercial lines remains, but that gap is closing,” said Triple-I Chief Insurance Officer Dale Porfilio. “The significant rate increases necessary to offset inflationary pressures on losses are driving the improved results in personal auto and homeowners. With that said, the impact of natural catastrophes such as Hurricanes Helene and Milton threaten the improved homeowners results and are a significant source of uncertainty.”
During the webinar Q&A period, Porfilio provided insight on the potential impact of Hurricane Milton on the Triple-I 2024 net combined ratio forecast during the Q&A portion. One key figure regarding potential catastrophe losses is the impact on the 2024 net combined ratio forecast of adding one additional billion dollars of catastrophe losses. Each additional billion dollars of catastrophe losses is an impact of one tenth of a percent on the forecast.
Triple-I has loaded an estimate for catastrophe losses for the second half of 2024 based on historical experience, trends, economic projections, etc. prior to Milton, so there is no expectation of needing to add $30 billion to $40 billion – the recent estimate published by Gallagher Re.
If there was a need to add an additional $30 billion in catastrophe losses, that would be a +3.0-point impact on the forecast.
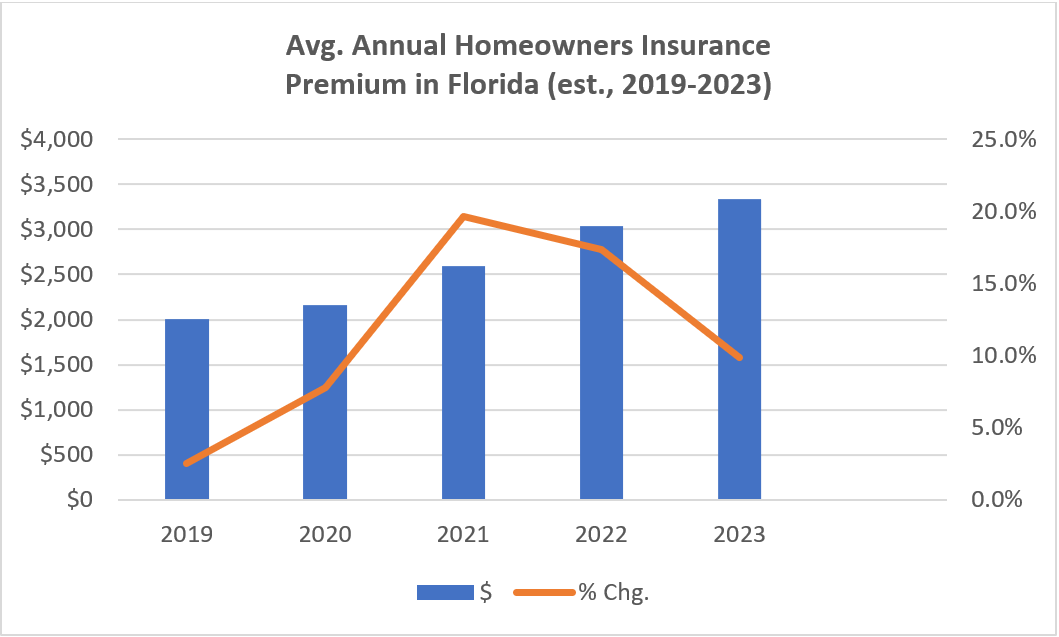
The net combined ratio for homeowners insurance of 104.9 was a six-point improvement over first-half 2023. The line is expected to achieve underwriting profitability in 2026, with continued double-digit growth in net written premiums expected in 2025.
Personal auto’s net combined ratio of 100 is 4.9 points better than 2023. The line’s 2024 net written premium growth rate of 14.5 percent is the highest in over 15 years.
Jason B. Kurtz – a principal and consulting actuary at Milliman – elaborated on profitability concerns within commercial lines. Commercial lines 2024 net combined ratio remained relatively flat at 97.1 percent. Improvements in commercial property, commercial multi-peril, and workers compensation were offset by continued deterioration in commercial auto and general liability.
“Commercial auto expectations are worsening and continue to remain unprofitable through at least 2026,” he said. “General liability has worsened and is expected to be unprofitable through 2026.”
Michel Léonard, Triple-I’s chief economist and data scientist, said P&C replacement costs are expected to overtake overall inflation in 2025.
“P&C carriers benefited from a ‘grace period’ over a few quarters during which replacement costs were increasing at a slower pace than overall inflation,” Dr. Léonard said. “That won’t be the case in 2025.”
It’s not too late to register for Triple-I’s Joint Industry Forum: Solutions for a New Age of Risk. Join us in Miami, Nov. 19 and 20.