

Source: Getty Images
With homeowners’ insurance replacement costs jumping 55% between 2020 and 2022 and nearly two-thirds of U.S. drivers finding auto insurance unaffordable, the personal lines insurance industry must transform from a reactive “repair-and-replace” model to a proactive “predict-and-prevent” approach to rebuild consumer trust and ensure long-term sustainability, according to a new whitepaper from Nationwide.
“With premiums on the rise, consumers have become increasingly anxious about affordability, coverage, and control. At the same time, carriers and agents are working harder than ever to retain customers in an environment where confidence is low and expectations are high,” said Casey Kempton, president of Nationwide Personal Lines and author of the report. “These challenges signal an opportunity to transform insurance in the minds of consumers. Today, we must promote a shift toward a model that encourages a predictive and preventive way of thinking amongst consumers.”
Economic and Environmental Pressures Create Perfect Storm
Three converging macro trends are fundamentally disrupting the traditional insurance model, according to Nationwide’s whitepaper. Economic uncertainty has made insurance increasingly unaffordable, with home values nearly doubling over the past decade and new automobile costs rising roughly 60% during the same period. Mortgage rates above 6% further strain household budgets, forcing consumers to make difficult choices about coverage.
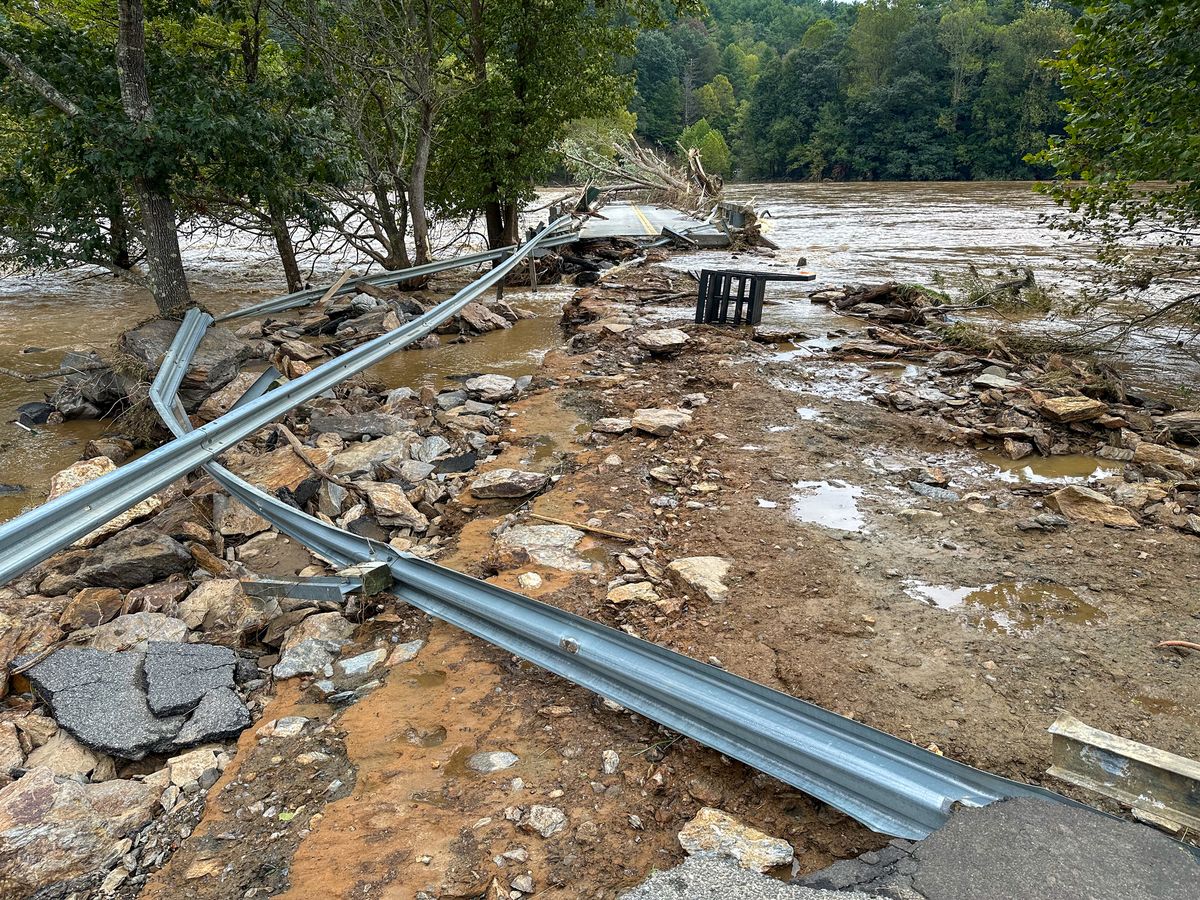
Simultaneously, weather-related catastrophes are increasing in both frequency and severity. Events once considered “100-year” occurrences now happen regularly, even affecting communities previously considered low-risk. The 2024 Hurricane Helene and 2025 Guadalupe River disasters devastated non-coastal areas across multiple states, demonstrating that traditional risk zones no longer apply.
Consumer behavior has shifted in response to these pressures, according to Nationwide. Twenty percent of consumers reported delaying necessary home renovations or repairs in 2024, adopting a “spend-later” mindset that increases future risk. On the roads, 92% of consumers report an increase in aggressive and distracted driving, while 88% note more instances of reckless driving overall.
Trust Crisis Threatens Industry Sustainability
These converging trends have created what the whitepaper describes as a “broken cycle of trust” between insurers, agents and consumers. As weather events become more unpredictable and repair costs escalate, insurers struggle with predictive models and pull back from markets or tighten underwriting standards. This leads to higher premiums and reduced coverage options, causing customers to lose trust and reevaluate their coverage.
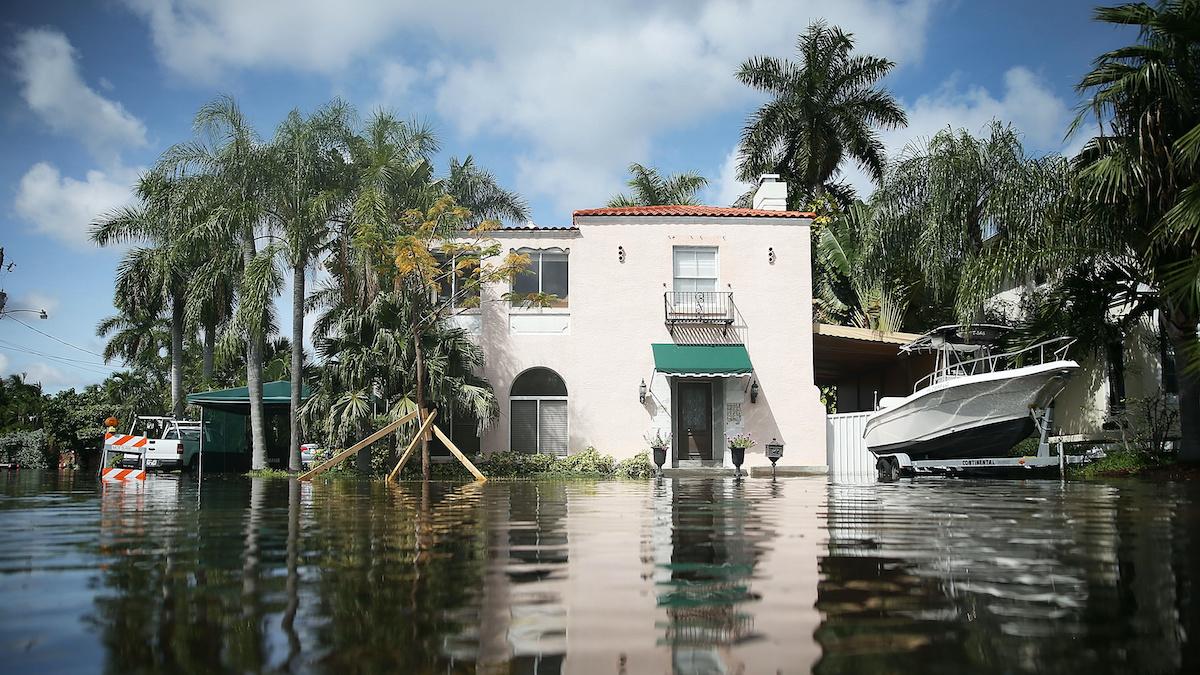
The cycle perpetuates itself as insurers experience lower customer retention and spend more on acquiring new customers rather than improving service, the whitepaper noted. In high-risk states like California and Florida, repeated disasters have led insurers to curtail coverage entirely, leaving both customers and agents scrambling for alternatives even as state regulators intervene.
The insurance industry has inadvertently trained consumers to focus on price rather than value through decades of “switch and save” advertising campaigns, according to the paper. This transactional approach has eroded the perceived value of insurance and weakened crucial relationships across the industry ecosystem.
Building Resilience Through Prevention and Partnership
The whitepaper proposes a comprehensive shift toward a predict and prevent mindset that positions insurers and agents as “assurance providers” rather than merely payers after losses occur. This transformation requires multiple stakeholders to work together on several fronts, according to Nationwide.
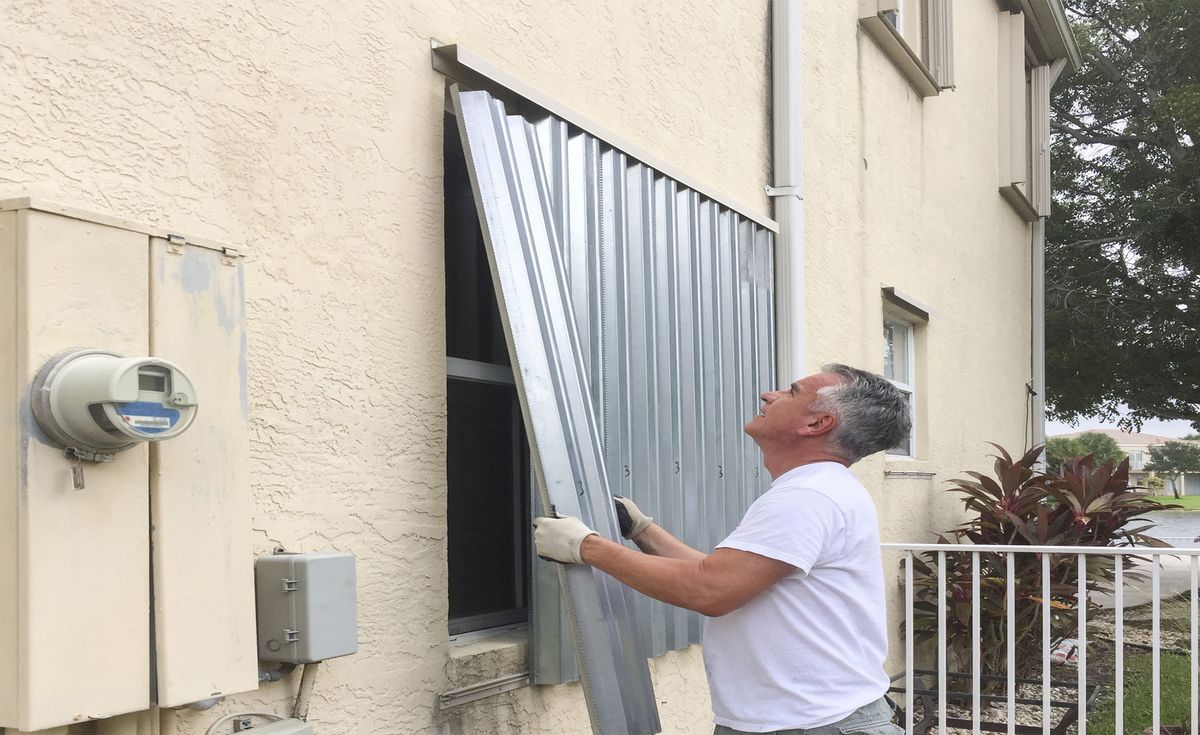
For technology adoption, smart home sensors can prevent water and electrical fire damage by catching issues early and alerting homeowners via smartphone. Similarly, safe driving programs using telematics provide real-time data about driving habits, helping customers build safer long-term behaviors.
Building standards represent another critical area for improvement. The whitepaper advocates for reinforcing FORTIFIED roof standards from the Insurance Institute for Business & Home Safety (IBHS), which help homes better withstand severe weather through sealed roof decks and regular inspections.
The transformation requires action from all industry participants:
- Carriers must invest in partnerships and innovations that reduce loss while sharing data and best practices across the industry.
- Agents and brokers need to shift from price-focused conversations to prevention-focused consultations, guiding customers toward safer choices and advocating for local safety reforms.
- Regulators and policymakers should support new pricing models and technologies while promoting safety legislation.
- Customers themselves must embrace insurance as protection for what matters most and adopt smart technologies that reduce risk.
“Shifting to a predict-and-prevent way of thinking helps consumers and everyone in our industry win,” Kempton said. “It can reduce losses and claims before they occur and lower premiums. It can also strengthen relationships, building the kind of customer loyalty and peace of mind that pricing alone can’t buy.”


