Category Archives: Insurance Industry

This is the default category

IRC report reveals that one in three drivers were either uninsured or underinsured in 2023. 

In 2023, despite nearly universal legal requirements to have auto insurance, more than one in seven drivers (15.4 percent) nationally were uninsured, and more than one in six drivers (18.0 percent) were underinsured, according to the new report, Uninsured and Underinsured Motorists: 2017–2023, by the Insurance Research Council (IRC), affiliated with The Institutes. Across the fifty states and the District of Columbia, one in three drivers (33.4 percent) were either uninsured or underinsured in 2023, a 10 percentage point increase in the combined rate since 2017.  

Using data submitted by 17 insurers — representing approximately 55 percent of the private passenger auto insurance market countrywide — this latest report estimated the prevalence of uninsured (UM) and underinsured (UIM) by comparing the frequency of UM claims and UIM claims, respectively, to the frequency of bodily injury (BI) claims. Findings included an analysis of trends and contributing factors to variations in UM and UIM rates across states. 

The IRC analyzed UM, UIM, and BI liability exposure and claim count data from participating companies for 2017 through 2023. Because of the disruption of the pandemic shutdowns, the changes over time were split into three periods (details outlined in the report).  

Key IRC findings include:  

  • UM rates varied substantially across the nation (50 states and the District of Columbia) 
  • Nearly every state saw a rise in the UM rate in 2020 with the onset of the pandemic, but the experience from 2020 to 2023 was mixed.  
  • Every state, except for New York and the District of Columbia, experienced a rise in UIM rate between 2017 and 2023.  
  • Many states with high UM rates often also have high UIM rates. However, some jurisdictions, such as Nevada and Louisiana, combine below-average UM rates with high UIM rates, while others, such as the District of Columbia, have high UM rates but low UIM rates.  
  • Several factors, including economic factors, insurance costs, and state insurance laws and regulations, are associated with variations in UM and UIM rates across states. 

After the initial shock of the pandemic, the UM rate increased steadily. 

Before the disruption of the COVID-19 pandemic, UM rates were falling in most states. From 2017 to 2019, only 11 jurisdictions saw an increase. UM claim frequency fell slightly in 2020 to 0.11 claims per 100 insured vehicles, but the decline was much smaller than the drop in BI claim frequency. UM claim frequency recovered quickly and, in the years since 2020, has grown faster than BI claim frequency (39 percent compared with 29 percent).   

As a result, the UM rate has increased steadily, reaching 15.4 percent in 2023. The range of the UM rates spanned from a low of 5.7 percent in Maine to a high of 28.2 percent in Mississippi. Outliers include eight states with UM rates above 20 percent and 11 states with rates lower than 10 percent.  

States with above-average BI claim frequency and UM claim frequency tended to have higher UM rates. Yet, some states with low UM claim frequency rates have a relatively high UM rate. In Michigan, for example, strict no-fault rules limit the number of BI claims, so the ratio of UM-to-BI claim frequencies is high. Lower UM rates tended to occur in states with higher income, lower unemployment rates, lower insurance expenditures, low minimum limits, and a lack of stacking provisions.  

UM rates were higher in states that don’t require UIM coverage. In 2023, the UM rate was 14.9 percent in states that do not require UIM insurance, compared with 11.6 percent in states that require it. Where UIM coverage isn’t required by law, UM rates were significantly higher in the years captured in this study, with the rate in 2023 at 18.9 percent in states that don’t require UIM insurance, compared with 13.3 percent in states that require it.   

Nearly one in five accidents with injuries involved losses more than the at-fault driver’s coverage limits. 

Over the study period, nearly every jurisdiction experienced an increase in its UIM rate. The only exceptions were a small decline (0.9%) in the District of Columbia and a 6.6 percent decline in New York. The largest increase occurred in Colorado, where the UIM rate rose 24.4 percentage points. Other states with above-average increases included Michigan, Kentucky, and Georgia.  

UIM claim frequency showed a small increase between 2017 and 2019 before dropping slightly in 2020. In the years since the onset of the pandemic, with the severity of auto injury claims on the rise, UIM claim frequency has increased markedly, reaching 0.17 claims per 100 insured vehicles in 2023. Since 2020, the growth in UIM claim frequency was double the growth in BI frequency. As a result, the UIM rate has increased significantly, rising to 18.0 percent in 2023.  

IRC analysis showed that characteristics associated with lower UIM rates included higher income, lower unemployment rates, lower insurance expenditures, high or medium minimum limits, lack of stacking provisions, and use of a limits trigger for UIM coverage rather than a damages trigger. States with high UM rates often also have high UIM rates. Florida, Colorado, and Michigan all rank relatively high for both measures, while Maine, Massachusetts, and Nebraska all rank relatively low.  

“The increase in UIM rates points to higher UIM premiums in the future, worsening affordability and potentially increasing the likelihood of more uninsured drivers. This demonstrates the complex interconnectedness of these two coverages as insurers protect consumers from insufficient coverage by at-fault drivers,” said Dale Porfilio, president of the IRC and chief insurance officer at the Insurance Information Institute (Triple-I). 

While state laws regarding mandatory requirements for uninsured and underinsured motorists vary, nearly all states have a legislation framework that requires all drivers to have some auto liability insurance to drive a motor vehicle. Drivers in most states are also required to purchase additional protection to provide coverage if the at-fault driver cannot afford to pay for the damage they caused. However, legislators in several states have enacted “no pay, no play” laws, which ban uninsured drivers from suing for noneconomic damages such as pain and suffering. A handful of states have programs to assist lower-income drivers, and drivers can check with their state’s insurance division to see if they are eligible.  

To learn more about UM/UIM trends, read the IRC report, Uninsured and Underinsured Motorists: 2017–2023, and check out the Triple-I Backgrounder on Compulsory Auto/Uninsured Motorists

South Carolina Analysis Shows Liquor Liability Insurance Market in Crisis

South Carolina’s liquor liability insurance market is in crisis, with insurers losing an average of $1.77 for every $1.00 of premium earned since 2017, while claim frequencies significantly outpace neighboring states, according to a recent study by the state’s Department of Insurance.

The comprehensive analysis, initiated following a 2019 request by the South Carolina Senate Judiciary Committee, reveals a deeply troubled marketplace where insurers are losing money.

“The data seem to confirm the anecdotal assertions, made by both insurance companies and small businesses, of a very troubled and challenged marketplace,” the report stated.

Current Market Landscape

The liquor liability insurance market in South Carolina has maintained a relatively stable number of participants in recent years. Since 2019, the number of insurance groups operating in this sector has held steady at around 48 participants. This consistency in market players suggests a mature, albeit challenging, insurance environment.

Despite the overall stability in participant numbers, the market is characterized by the dominance of three major insurance groups.

Premium Trends

While the number of market participants has remained relatively constant, earned premiums have experienced remarkable growth over a five-year period. From 2017 to 2022, earned premiums in the South Carolina liquor liability insurance market more than doubled to $17.0 million from $7.6 million.

This dramatic surge in premiums can be attributed to various factors, but rising insurance rates play a crucial role, the report noted.

Profitability Crisis in South Carolina

Since 2017, liquor liability insurers have lost about $1.77 for every $1.00 of premium earned over the six years observed. In the best performing of those six years (2018), the industry lost roughly $0.91 per $1.00 of premiums earned, while losing about $2.60 per $1.00 of premiums earned in the worst performing year, 2022.

“Combined ratios for the industry make it clear that this sub-line of insurance is being written at massive underwriting losses,” the report’s authors stated.

Source: South Carolina Department of Insurance

The severity of South Carolina’s liquor liability insurance crisis becomes even more apparent when compared to their neighboring states, where these same insurers have realized a net profit over time, the report noted.

Over the same 2017-2022 period analyzed, for example, North Carolina’s estimated liquor liability combined ratio ranged between 45% and 76%. In 2022, when South Carolina’s estimated combined ratio hit 290%, North Carolina’s stood at 62%.

Claims Severity and Frequency

The liquor liability insurance market in South Carolina also has experienced significant fluctuations in claim severity over recent years. In 2022, the average incurred claim per $1 million of earned premium reached $281,071, a substantial increase from $121,761 the previous year. This figure, however, falls within a broader historical context of volatility. The state witnessed its highest average claim of $338,244 in 2017, followed by a dramatic drop to $121,761 in 2021.

Despite these fluctuations, recent data suggests that South Carolina’s claim severity is aligning more closely with neighboring states in recent years, according to the report.

While severity trends show signs of alignment with regional norms, claim frequency in South Carolina presents a more pressing challenge.

From 2019 to 2022, South Carolina’s claim frequency (number of incurred claims per $1 million of earned premium) has outpaced that observed in the other states considerably. The claims frequency rate was nine in 2022, 13 in 2021, 10 in 2020 and 12 in 2019. During that same period, none of its neighboring states — Florida, Georgia and North Carolina — reported a claims frequency rate higher than five.

View the full South Carolina report here.

Triple-I Chart of the Week, Representation of Black professionals in Insurance: Growing, But Slowly

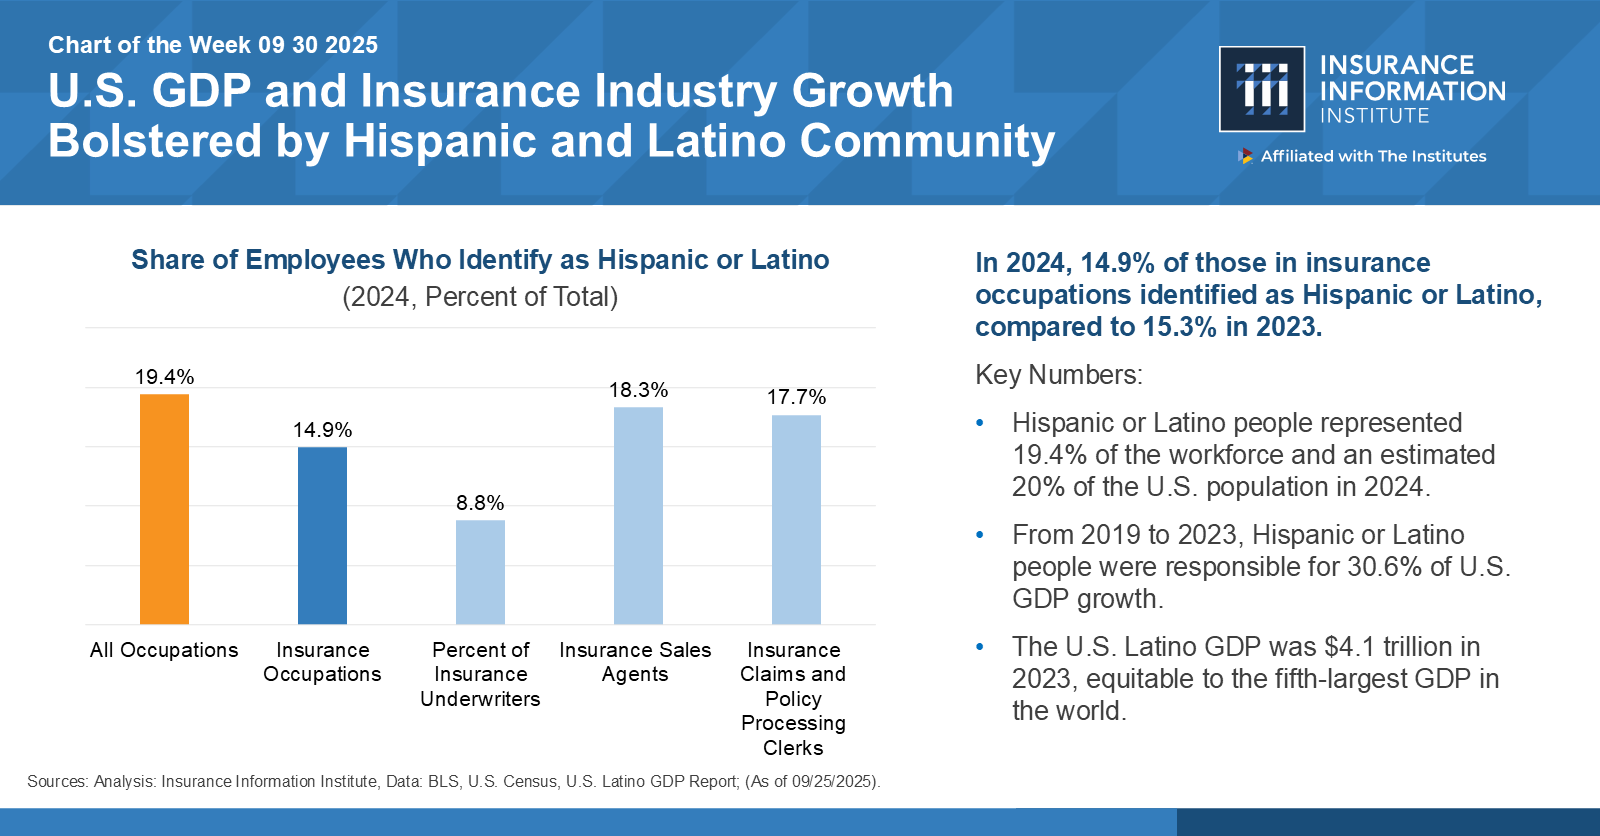
On February 10, Triple-I released its latest Chart of the Week (COTW), “Representation of Black professionals in Insurance: Growing, But Slowly.” Citing data from the Bureau of Labor Statistics, the chart reveals that in 2024, Black professionals comprised 14.7 percent of the insurance industry, just a 0.1 percent increase from 2023 but still considerably up from 9.9 percent a decade ago. Triple-I’s snapshot shows some occupation categories: underwriters comprised 14.6 percent, agents 13.5 percent, and claims and policy processing clerks 21.9 percent.

The most recent BLS data also shows Black representation among claims adjusters, appraisers, examiners, and investigators is at 20.9 percent. Last year’s version of the chart revealed (using data from 2020) that Black professionals accounted for only 1.8 percent of senior executives at the top ten US insurers. (In 2024, Black CEO representation across the Fortune 500 was only 1.6 percent, an all-time high.) Overall, insurers have welcomed Black professionals at proportions commensurate with their proportion of the overall US workforce but have not managed to make headway in the C-suite.

According to BLS data cited in an AM Best report, total employment in the industry had surpassed 3 million by August 2023. However, employers could face massive attrition as thousands of workers (along with their leadership skills and knowledge) retire from the workforce in the coming years.

Attracting and retaining top talent remains a key business strategy for organizations that want to keep delivering world-class results and growth. As the insurance industry collects revenues from virtually every household in America, a workforce that reflects this enormous marketplace can tap into a diversity of thought and experience to help address the industry’s challenges, including making products affordable and available to cover a broad range of risks.

A Boston Consulting Group study revealed that companies with above-average diversity in their leadership teams reported innovation revenue at rates 19 percentage points higher than those with below-average diversity in management. Again, the ability of the industry’s aging workforce to connect with younger generations will be pivotal. US millennials and Gen Zers command nearly $3 trillion in spending power each year.

Progress towards diverse talent recruitment and retention goals can hinge upon cultivating a workplace where all employees feel welcome, supported, fulfilled, and empowered to keep growing professionally. Nonetheless, a lack of diversity at the C-suite level can undermine efforts to incorporate driven and career-focused candidates, especially among millennials and GenZ professionals. Rising generations are wary of glass ceilings and may want proof that inclusion and equity come from the top.

Data indicates that companies tend to employ Black professionals more often in jobs that don’t typically lead to higher roles instead of taking deliberate and strategic efforts to increase Black representation in areas close to centers of profit and strategic decision-making. These employees are taken out of the line of sight for getting tapped and groomed for opportunities that can lead to the C-suite. Insurers keen on Black talent development can open opportunities for Black employees to learn about what’s above that mid-level management ceiling and make connections. Organizations such as Black Insurance Industry Collective (BIIC) offer this and other types of strategic assistance to the industry for advancing, retaining, and empowering Black talent at the executive level.

“The momentum is clear—BIIC is not just shaping the conversation but actively driving meaningful change within the insurance industry,” says Amy-Cole Smith, Executive Director for BIIC and Director of Diversity at The Institutes.

Since its inception three years ago, BIIC has endeavored to support Black leaders within the risk management and insurance industry in full partnership with some of the largest insurance organizations. To date, 22 organizations have joined forces with BIIC to advance this mission.

Cole-Smith says, “By fostering mentorship, leadership development, and strategic networking opportunities, BIIC is creating tangible pathways for Black professionals to ascend into executive roles, influence key industry decisions, and pave the way for future generations.”

In addition to engaging over 4,000 professionals through its bespoke content designed to raise awareness and foster discussion of key topics relevant to this mission, BIIC has also supported over 135 emerging, mid-level, and senior Black professional leaders through its Executive Leadership Program, a collaboration with Darden Executive Education and Lifelong Learning. 

“Through its commitment to equity, inclusion, and professional excellence, BIIC is not only elevating individual careers but also transforming the industry’s leadership landscape, ensuring that diverse perspectives and voices shape its future,” according to Cole-Smith.

New Triple-I Issue Brief Puts the Spotlight on Georgia’s Insurance Affordability Crisis

Insurance affordability in Georgia is dwindling as claim frequency and insurer costs soar, according to the latest issue brief from Insurance Information Institute (Triple-I), Trends and Insights: Georgia Insurance Affordability.  

Given the state’s below-average income vs. above-average insurance expenditures, Georgia ranks 42nd on the list of affordable states for homeowners insurance and 47th (plummeting from the 2006 high of 27th) for personal auto affordability, according to reports by the Insurance Research Council. This brief provides an overview of how several factors, including skyrocketing costs from litigation, pose risks to coverage affordability, availability, and other potential economic outcomes for Georgia residents. Tort reform is discussed as a legislative solution to the challenge of legal system abuse – excessive policyholder or plaintiff attorney practices that increase costs and time to settle insurance claims. 

The Georgia insurance market grapples with multiple risk factors 

From 1980–2024, Georgia was impacted by 134 confirmed weather/climate disaster events in which losses exceeded $1 billion each. At least 38 of those events happened in the last five years, with 14 in 2023. Homeowners in Georgia’s most climate-risk-vulnerable counties, such as the coastal and most southern parts of the state, can face double-digit premium hikes or nonrenewals. Also, data indicates the rate of underinsured motorists in Georgia is twice as high as the national average, and the rate of uninsured motorists is 25 percent higher. Injury claim severity in the state is slightly higher than in the rest of the country.   

Data indicates that litigation costs have become a pervasive concern for risk management. 

Rising claim frequency and litigation costs put coverage affordability and availability at risk. For example, the IRC findings across personal auto lines show a dual trend in Georgia of increased claims and litigation. Property damage liability claims per 100 insured vehicles are 15 percent higher, and relative body injury claims frequency is 60 percent higher. According to IRC, the rate for private passenger litigation in Georgia is nearly three times that in the median state. 

The Georgia Office of Commissioner of Insurance and Safety Fire (“OCI”) reviewed all lines across personal and commercial auto, personal and commercial umbrella, and commercial general liability (homeowners liability was excluded). The five-year average count for liability claims increased 24.9 percent (2014 – 2018 at 583,756 vs. 2019-2023 at 729,191). A rising percentage of claims with payment are full-limit claims, and the OCI analysis indicates litigation is driving that increase. While costs rose for both litigated and non-litigated claims, the number of claims with legal involvement dominated paid indemnity for most lines of business, and litigated claims comprised a growing portion of the total paid indemnity. 

Attorneys appear to have revved up their mining for lawsuits in Georgia. Law firms spent $160 million on advertising in Georgia, according to preliminary data from the American Tort Reform Association (ATRA). Outdoor ads for lawsuits increased by 119 percent in GA during that time. It might not be a surprise then to see that the Georgia OCI report shows legal (attorney involved) claims dominated Personal Auto claims for Bodily Injury, comprising 62 percent of claims and 86 percent of total indemnity paid for closed claims in Accident Year 2023. A review of losses of $1 million or more by accident year that have closed during the 2014 to 2023 period shows that each accident year cohort surpasses the count from the previous accident years.   

Recently introduced state tort reform legislation may help to stabilize insurance costs. 

Analysts estimate that litigation costs Georgia residents $880 million annually, or an average of $1,415 per resident.  Sean Kevelighan, Triple-I CEO, says “understanding how these trends drive up costs and identifying policy levers for tort reform legislation can ultimately bring positive outcomes for Georgia’s economy and its consumers and business owners.” 

As part of our commitment to educating stakeholders, Triple-I has launched a multi-faceted campaign to raise awareness of the mounting costs of legal system abuse in Georgia and other states. We invite you to view the video statement by our CEO Sean Kevelighan, interviews capturing the opinions of consumers about legal system abuse, and read the full issue brief, Trends and Insights: Georgia Insurance Affordability. 

New IRC report indicates that Most Homeowners Expect to Experience Severe Weather in Future and Feel Prepared. 

While the perception of overall severe weather risks varies significantly by region, 65 percent of the participants nationwide believed their home is at risk from thunderstorms, according to the new report, Catastrophic Weather Events and Mitigation: Survey of Homeowners by the Insurance Research Council (IRC), a division of The Institutes. 

Overall, this and other key report findings revolve around the value of proactive measures for effective preparedness and mitigation strategies to address the increasing risks posed by severe weather events and the need for collaboration between homeowners, insurers, and governments to enhance resilience against natural disasters. The report highlights how interactions with contractors, public adjusters, and attorney involvement can significantly impact recovery timelines, claims frequency, and insurance costs. 

The online survey of over 1,500 respondents investigates U.S. public opinions and homeowners’ experiences with severe weather, offering insights on U.S. regional perceptions of future risks, preparedness levels, attitudes toward mitigation strategies, post-storm solicitations by contractors and service providers, and homeowners; opinions on the roles of insurance and government in managing severe weather-related risks.  

Disaster anticipation and preparedness 

Eighty percent of the responding homeowners expressed confidence in their preparedness for severe weather events. Homeowners participating in the survey who experienced severe weather events in the past five years were significantly more likely to believe that a similar event would occur within the next five years.  

Only 30 percent are aware of premium savings for implementing mitigation measures. However, Eighty-three percent of participants said they would consider implementing catastrophe preparedness and mitigation measures if it meant receiving savings on their insurance premiums, but most of those required premium savings large enough to offset the costs of these measures. Seventy percent revealed they would be willing to pay higher premiums for better protection against future severe weather events. Overall, 80 percent agreed that the government should provide emergency assistance.  

Weather Experiences 

Nearly half of the participants reported damage to their homes after a severe weather event. About 34 percent said they filed an insurance claim after experiencing damage to their homes, and 45 percent said they hired a contractor. Sixty-four percent of respondents reported receiving solicitation from contractors after a severe weather event. Also, 68 percent of participants who filed claims said they used Assignment of Benefits (AOB) to authorize the repair company to bill the insurance carrier. Fifty-four percent reported hiring public adjusters to handle repairs and insurance claims.  

For context, each year, there are about 100,000 thunderstorms in the U.S., about 10% of which reach severe levels, according to the National Oceanic and Atmospheric Administration (NOAA). Storms are classified as severe “ when containing one or more of the following: hail one inch or greater, winds gusting more than 50 knots (57.5 mph), or a tornado.” Data analysis from Munich Re indicates that by just the first six months of 2024, severe thunderstorms in the U.S. caused $45 billion in losses, $34 billion of which were insured, making 2024 the fourth-costliest thunderstorm year on record.  

Between 1980 and 2024 (as of November 1), the U.S. experienced 400 weather and climate disasters, with overall damage costs for each reaching or exceeding $1 billion. The cumulative cost for these 400 events exceeds $2.78 trillion. The yearly average for events during this period is 8.5, with the annual average for 2019 –2023 being 20.4. However, the U.S. experienced 28 events in 2023 and 27 events in 2024 costing at least 1 billion dollars each. 

Stakeholder Takeaways 

While climate risk plays a significant role in the number and severity of extreme weather events that cause insurance industry losses, Triple-I has kept an eye on the impact of the unpredictable confluence of attorney fee mechanisms, assignment of benefits (AOB), and other practices that can amplify claim costs. For example, involving third parties has the propensity to introduce the risk of claim inflation and may compound issues for the policyholder.  

When property owners are compelled to share their claim value (typically 30 – 40 percent to attorneys and 10 – 30 percent to public adjusters), this, in turn, may impact the final amount they feel necessary to settle a claim. Previous IRC research suggests that attorney involvement can increase claims costs and the time needed to resolve them (again, even while reducing value for claimants). Additionally, after a severe weather event, some exploitative actors can aggressively leverage assignment of benefits (AOBs) agreements to bill or even sue the insurer without further input from the policyholder. Policyholders lose the ability to work through and settle the claim efficiently. 

Triple-I and key insurance industry stakeholders define legal system abuse as policyholder or plaintiff attorney practices that increase costs and time to settle insurance claims, including situations when a disputed claim could have been fairly resolved without judicial intervention. Without measures such as regulatory intervention and increased policyholder awareness, coverage affordability and availability are at risk. Insurers, policyholders, and policymakers can take actionable steps to address the legal system’s impact on the cost of insurance. Triple-I remains committed to advancing the conversation and exploring actionable strategies with all stakeholders.  

To learn more, read this latest IRC report, our most recent brief on Legal System abuse, and follow our blog. 

Triple-I Brief: Commercial Property Insurance Shows Signs of Improvement, Stable Growth

While rising premiums have been the primary driver for commercial property insurance growth for years, a 25-quarter rate increase streak broke in early 2024. Strong risk-adjusted capitalization and adequate liquidity may sustain the stable outlook, notwithstanding formidable risks, according to Triple-I’s latest insurance brief Commercial Property: Trends and Insights.

The brief focuses on several core trends shaping opportunities and threats to the commercial property insurance segment:

  • Mounting climate and natural catastrophe risks
  • Increasing capacity in the reinsurance market
  • Lurking undervaluation risk
  • Rise of AI and technology in risk mitigation

According to a recent McKinsey report, data involving global figures for 25 primary commercial lines carriers indicate a combined ratio of 91 percent for 2023, down from a high of 102 in 2020 but holding steady from the prior year. Commercial property comprised $254 billion (or 26 percent) of premiums across these carriers.

Before 2024, the overall U.S. P&C commercial market experienced hard market conditions going back to 2018, according to NAIC data and analysis. Double-digit rate increases were the norm, particularly for properties in high-risk regions or with poor loss histories. A Marsh McLennan report shows that in Q4 2023, rate increases averaged 11 percent for more considerable commercial property risks and even higher for accounts with loss history challenges or catastrophic exposure.  Carriers have delivered steady quarterly increases since 2017 “to offset pressures from catastrophes and economic and social inflation.” Capacity constraints, driven by increased reinsurance costs, compounded this hardening, creating challenges for insurers and policyholders.

However, commercial insurers benefited from underwriting margins that outperformed the long-term average despite slowing year-over-year growth in direct premiums written, according to the 2024 S&P Global Market Intelligence U.S. Property and Casualty Industry Performance Rankings report. The top 50 of the 100 evaluated carriers was dominated by commercial line providers, with insurers focusing primarily on commercial property lines capturing three of the top 10 spots. In comparison, only two personal lines carriers ranked in the top 50.

AM Best, which maintains that insured losses in recent years have been driven primarily by secondary perils such as severe convective storms, issued its “Market Segment Outlook: US Commercial Lines” report. The analysts predict a stable market segment outlook for the U.S. commercial lines insurance sector in 2025. The company expects the commercial lines segment “will remain profitable in the aggregate and will be resilient in the face of near- and longer-term challenges.” However, relatively high claims costs, the multi-year impact of social inflation, and geopolitical risks may pose threats. The latest AM Best report focused solely on the commercial property segment (dated March 2024) advises that the Excess and Surplus (E&S) market has absorbed some of the higher risks. Still, overall secondary perils continue to be a significant “offsetting factor” for commercial property.

The damage of weather events and natural catastrophes tend to make big headlines (and rightly so), but the overall risk for commercial property isn’t limited to the destruction wrought by each disaster. It also extends to the interactions between the event outcomes and human systems. Specifically, these events can strain regional economic systems, such as decreasing the availability of rebuilding materials and labor while simultaneously amplifying demand for these same inputs. In turn, property replacement costs can soar.

Reinsurance

In 2023, major changes in reinsurance policy structures and price increases compelled insurers to decrease limits and absorb higher retentions. The policy restructurings also meant primary insurers had to retain more losses from increased secondary perils, such as floods, wildfires, and severe convective storms, that they could not cede to the reinsurance market. The insurers’ retention of loss may have allowed the incubation of increased capacity in the reinsurance market, improving late in 2023 and into early 2024.

By mid-year 2024 renewals, reinsurance appetite had grown with easing in some loss-free areas and, as applicable, underwriting scrutiny held firm in others areas. Analysts observed “flat to down mid-to high-single digits” reinsurance risk-adjusted rates for global property catastrophes. A Marsh McLennan report noted modest growth in investment and capital due to increased market capacity and underwriting interest from carriers. Late 2024 catastrophic events and any similar activities in the coming year will likely remain a primary drivers for reinsurance costs, along with the increasing cost of capital, financial market volatility, and economic inflation.

To learn more about Triple-I’s take on these and other commercial property insurance trends, read the issue brief and follow our blog.

RiskScan 2024 reveals risk priorities across the insurance marketplace

By Mary Sams, Senior Research Analyst

Cyber incidents, changes in climate, and business interruption are the chief risk concerns among key marketplace segments in the insurance industry, according to RiskScan 2024, a new survey from Munich Reinsurance America Inc. (“Munich Re US”) and the Insurance Information Institute (Triple-I) reveals.

RiskScan 2024 provides a cross-market overview of top risk concerns among individuals across five key market segments: P&C insurance carriers, P&C agents and brokers, middle-market business decision makers, small business owners, and consumers. The survey explores not only P&C risks, but also how economic, political, and legal pressures shape risk perceptions. 

Methodology

To produce a compelling snapshot of cross-market views, Munich Re US and Triple-I engaged independent market researcher RTi Research in the summer of 2024 to survey 1,300 US-based individuals.

Market surveys typically focus on a single audience, but RiskScan 2024 is a multi-segment survey offering a comprehensive view of risk perceptions and yielding comparative results between audiences. The key insights present a variety of commonalities and disparities across the five distinct target segments, covering the full range of insurance buyers and sellers across the United States.

This online survey was conducted across gender, age, geographic region, household income, business revenue, and company size. 

Two primary cohorts make up five segments of participants in the RiskScan research:

  1. consumers and small business owners (n=700) and
  1. Insurance industry participants, which included carriers, agents, and brokers as well as middle market businesses (n=600). 

Research participants were presented with various risks across five segments and then asked to select their top three risk concerns. 

Key Insights

More than one-third of respondents chose economic inflation, cyber incidents, and climate change as their top three concerns based on insurance risks and market dynamics. All three of these reflect post-pandemic news topics. Economic inflation has increased over the last several years.  Consumers and small business owners have experienced direct impacts with increased costs and industry participants have seen these impacts on increased replacement costs and P&C insurance premiums.

There are significant disparities in the ranking results between the two primary cohorts within the research. Insurance professionals tend to identify a variety of risks and have significant awareness of all risk categories, including emerging technologies. As expected, these audiences exhibit broader knowledge and awareness of risk transfer and mitigation of new and emerging risks. Consumers identified a smaller number of risks associated with more immediate and direct impacts on themselves. 

The structure of RiskScan 2024 research yields a more complete understanding of the “white space” that exists between risk perception and action. The gaps were identified along three key risk areas: 

  • Flood risk
  • cyber risks, and
  • legal system abuse

Flood risk was also indicated as one of the chief concerns for each audience. However, consumers lack awareness that flood events are typically excluded from homeowner’s policies. Industry professionals are more aware of flood coverage exclusions, the importance of purchasing flood coverage before a flood event, and the likelihood of these events occurring.

Cyber incidents are a primary concern in all five market segments. Most audiences in the research, both consumer and commercial, feel unprepared as this threat vector is constantly emerging, expanding, and changing. Many people are knowledgeable about cyber risks and are concerned about how to mitigate new cyber threats. Troubling stories have come to light as the frequency and severity of cyber threats grow.

“The knowledge gap about insurance risks demonstrates the continued need for education of consumers and businesses, especially about flood, cyber, and legal system abuse,” says Triple-I CEO Sean Kevelighan. “Increasing knowledge will be instrumental for the collective work needed to better manage and mitigate future risks.”

The report includes additional results for each of the five primary audiences: consumers (n=500), small business owners (n=200), insurance carriers (n=200), insurance agents and brokers (n=200), and middle market businesses (n=200).

Download the full RiskScan 2024 report to review the details. Triple-I aims to empower stakeholders by driving research and education on this and other key insurance topics. Follow our blog to keep abreast of these essential conversations.

Climate Resilience and Legal System Abuse Take Center Stage In Miami

Triple-I’s Joint Industry Forum this week in Miami brought together subject-matter experts from across insurance, academia, government, and the nonprofit space to discuss climate resilience, legal system abuse, and – most important – what is being done and must continue to be done to ensure insurance availability and affordability during this period of evolving perils and policy challenges.

The insight-rich and engaging panels and “Risk Takes” will be generating Triple-I blog content for weeks to come. The following is a brief wrap-up.

While our times are “riskier than ever,” Triple-I CEO Sean Kevelighan pointed out that the U.S. property/casualty insurance industry “is well poised to manage these risks.” At the same time, he and many participants noted that collaboration and coalition building are critical for long-term success.

With respect to climate resilience, such collaboration is already taking place. Veronika Torarp, a partner in PwC Strategy’s insurance practice and moderator of the Climate Resilience panel, discussed the multi-industry coalition PwC is developing with Triple-I and other partners. Marsh McLennan’s managing director for public sector Dan Kaniewski – who moderated the Success Stories panel – discussed a project funded last year by Fannie Mae and managed by the National Institute of Building Sciences (NIBS) that culminated in a roadmap to incentivize investment in urban flood resilience across “co-beneficiary” groups.. Triple-I played an integral role in the NIBS project, which is currently seeking communities and partners for implementation of the roadmap.

In the area of legal system abuse, there was much conversation around the benefits to Florida of recent reforms in terms of making the Sunshine State more attractive to insurers again by discouraging excessive and fraudulent litigation. Legal system abuse is a multi-headed monster that drives up costs for everyone – from home and car owners to businesses and taxpayers – and, although progress has been made to fight it in Florida and elsewhere, it is expanding as quickly as those states are able to advance in tamping it down. Triple-I’s Dale Porfilio moderated a lively panel on the topic that included Louisiana Insurance Commissioner Tim Temple; Farmers Insurance head of legislative affairs Jeff Sauls; Viji Rangaswami, senior vice president and chief public affairs officer for Liberty Mutual; and Jerry Theodorou, policy director for finance, insurance, and trade at the R Street Institute.

Peter Miller, president and CEO of The Institutes, moderated the Innovation panel, which included Denise Garth, chief strategy officer at Majesco; Paul O’Connor, vice president of operational excellence at ServiceMaster; Kenneth Tolson, global president for digital solutions at Crawford & Co.; and Reggie Townsend, vice president and head of the data ethics practice at SAS. These subject-matter experts discussed how generative AI and other technologies are transforming insurance strategy and operations and increasing opportunities to improve and advance this most human-centered industry.

All four panels – as well as the Risk Takes and the “Fireside Chat” featuring Kate Horowitz, executive vice president of The Institutes, and Casey Kempton, president of personal lines for Nationwide Insurance – will be reported on in greater detail in subsequent posts.

New IRC Report:
Personal Auto Insurance
State Regulation Systems

By William Nibbelin, Senior Research Actuary, Triple-I 

According to a new study by the Insurance Research Council (IRC), the rate filing process for personal auto insurance has become more inefficient and ineffective, taking longer to achieve rate approval with higher occurrence of approved rate impact lower than filed rate impact and a larger disparity between the rate impact approved and the rate impact filed.

The report, Rate Regulation in Personal Auto Insurance: A Comparison of State Systems, analyzes Personal Auto Insurance industry data from 2010 through 2023 across all states and the District of Columbia. Key findings:

  • There were approximately 10,200 rate filings each year without much variance during the period.
  • The average number of days to approval grew from 39 to 54 days.
  • The number of filings withdrawn increased from 1,900 to 3,200.
  • The percentage of filings receiving less rate impact than requested grew 10 points.
  • The disparity in approved rate impact grew by more than 2 points.
  • Market concentration (as measured by the Herfindahl-Hirschman Index, or HHI) increased by 9 percent.
  • A strong-to-moderate correlation exists between net underwriting losses and premium shortfalls within states and across time.
  • Filing process measures and market outcomes vary by regulatory systems.

During this same period from 2010 through 2023, the personal auto insurance industry experienced a direct combined ratio over 100 in 11 of the 14 years. Combined ratio is a key measure of underwriting profitability for insurance carriers, calculated as losses and expenses divided by earned premium plus operating expenses divided by written premium. A combined ratio over 100 represents an underwriting loss. The report includes the determination of a strong correlation between underwriting loss and premium shortfalls, defined as the potential dollar difference between the effective filed rate impact and approved rate impact.

Overview of Rate Regulation

Insurance is regulated by the states. This system of regulation stems from the McCarran-Ferguson Act of 1945, which describes state regulation and taxation of the industry as being in “the public interest” and clearly gives it preeminence over federal law.

While the regulatory processes in each state vary, three principles guide every state’s rate regulation system (Regulation | III): that rates be adequate (to maintain insurance company solvency) but not excessive (not so high as to lead to exorbitant profits) nor unfairly discriminatory (price differences must reflect expected claim and expense differences).

According to the NAIC (NAIC Auto Insurance Database Report, p. 193), the primary regulatory approaches include:

  • Prior Approval System: Insurance companies must file their rates and get approval from the state insurance department before using them.
  • Flex Rating: States allow insurers to change rates within a pre-established range (often a percentage increase or decrease) without needing approval. Larger changes, however, require prior approval.
  • File-and-Use System: Insurers can file rates with the state and begin using them immediately or after a set period. The rates can still be reviewed by regulators, but they do not require prior approval.
  • Use-and-File System: Insurers can implement new rates without prior approval but must file them with the state within a certain period after they start being used. Regulators can review and potentially disapprove them later.
  • No Filing: In some states, insurers do not have to file rates for certain lines of insurance. The idea is that competition among insurers will keep rates in check. However, regulators still have authority to intervene if rates are deemed unreasonable.

Regulatory Systems

IRC used National Association of Insurance Commissioners (NAIC) definitions to segment states into four regulatory systems: Prior Approval, File and Use, Use and File (including No Filing states), and an additional segment, Rate Cap, for Flex Rating states and any state with an explicit rate impact cap on rate filings per state regulations.

The report then highlights key findings and other market outcomes across these four regulatory environment systems. For example, the study determined underwriting profitability in personal auto insurance was weakest in Rate Cap states across the period from 2010 through 2023 with the highest average direct combined ratio of any regulatory environment system in 2023. Prior Approval states had the second highest.

Below are some of the results of this study for California personal auto, which performs worse on several key rate filing process measures.

California

California has an explicit rate cap of 7 percent (California Insurance Code Article 161.05) and is therefore classified as a Rate Cap regulatory environment system in the IRC study. California only rivals Colorado for the highest average number of days to approval over the past seven years and has the highest average number of days to approval for 2023 at 246 compared to the next highest, Colorado, at 167.

California also has the highest average withdrawn rate across all states at 14.1 percent from 2010 to 2023. From 2010 to 2023, California achieved a Direct Combined Ratio under 100 four times, and the most recent three-year direct combined ratio is 110.4, compared to the countrywide 106.4. The residual market has grown in California from 0.01 percent in 2010 to 0.09 percent in 2021 which is higher than the countrywide average of 0.07 percent.

US Consumers See Link Between Attorney Involvement in Claims and Higher Auto Insurance Costs: New IRC Report

According to a new survey conducted by the Insurance Research Council (IRC), most consumers believe attorney advertising increases the number of claims and lawsuits and the cost of auto insurance.

The report, Public Opinions on Attorney Involvement in Claims, analyzes consumer opinions on attorney involvement in insurance claims and expands prior research. Overall, 60 percent of 2000 respondents in this latest nationwide online survey from IRC said that attorney advertising increases the number of claims, and 52 percent said that advertising increases the cost of insurance. Most respondents (89 percent) reported seeing attorney advertising in the past year, and about half reported seeing an increase in the amount of attorney advertising.

The IRC endeavored to gauge perceptions of attorney advertising and its impact on the cost of insurance, consumer awareness and understanding of litigation financing practices, and decisions about consulting attorneys about auto insurance claims. The main lines of inquiry in the survey revolved around:

  • How has the public experienced attorney advertising, and what do they think of the impact?
  • Are they aware of litigation financing, and after being given a description, what do they think of it?
  • Would they be more likely to hire an attorney to help settle an insurance claim or to settle directly with an insurer?
  • What was their previous history with auto insurance claims and their experience with consulting a lawyer to help settle an injury claim?

Results indicate that consumers are exposed to more attorney advertising across most mediums – particularly in outdoor ads, with auto accident advertisements being the most prevalent medium – compared to three years ago. While billboard advertising has experienced the most growth over the past three years, TV is the most recalled medium, with 65 percent of respondents recalling seeing TV ads in the past year.

The study reveals the awareness of litigation financing has risen significantly, but most respondents remain neutral in their opinions. Nonetheless, results show consumers want transparency around the involvement of third-party litigation funding in a case. When asked, “To what extent do you agree or disagree that the participants in a lawsuit should be informed when outside investors are financing the litigation,” 69 percent said they agree.

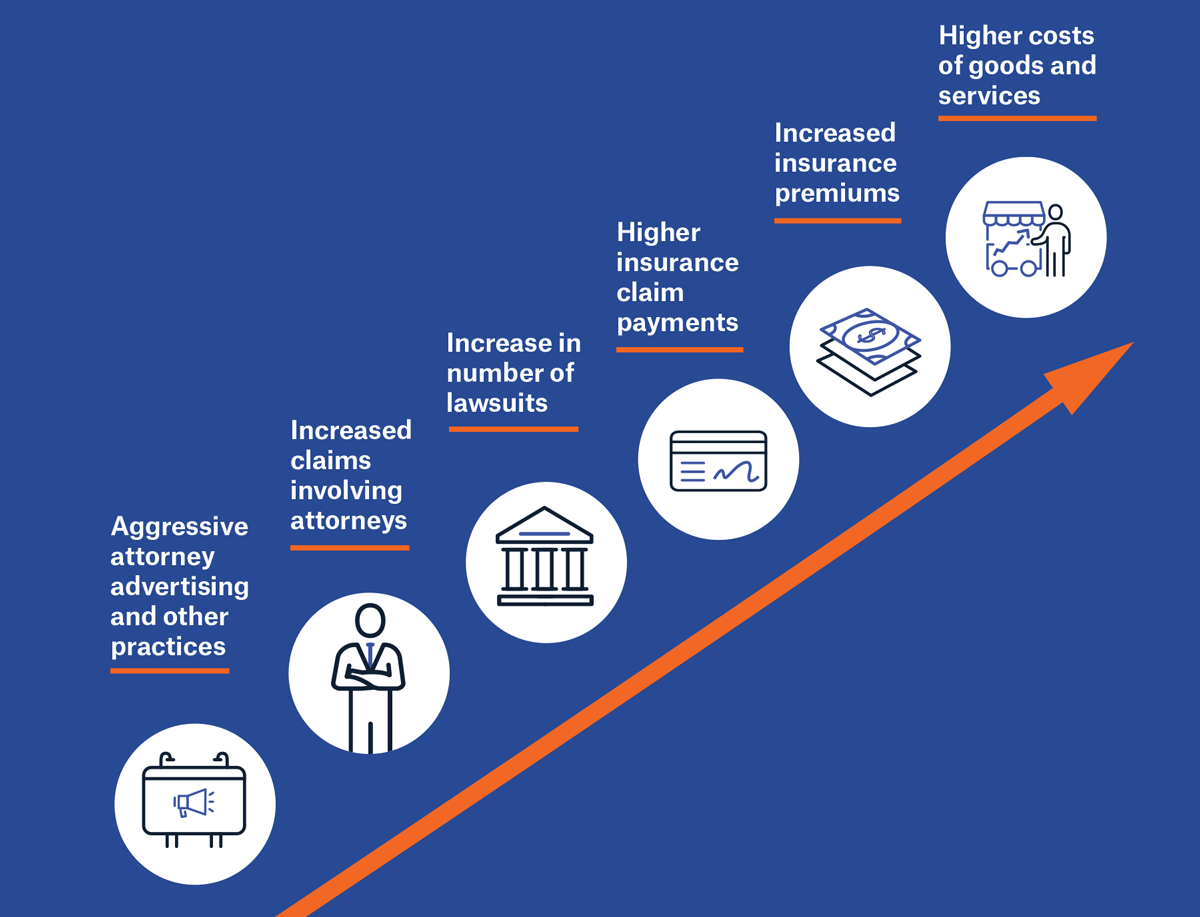
How might increased attorney advertising fuel legal system abuse?

IRC’s findings support a “significant statistical correlation between whether respondents consulted an attorney and their exposure to advertising. Among those who reported seeing attorney advertising, 74 percent consulted an attorney, compared to 48 percent among those who had not seen attorney advertising.”

The American Tort Reform Association (ATRA) estimates that in 2023, over $2.4 billion was spent on local legal services advertising through television, radio, print ads, and billboards across the United States.  Meanwhile, only 47 percent of respondents in a 2023 American Bar Association (ABA) survey said their firm had an annual marketing budget – a decline from 57 percent in 2022. About 80 percent of the solo practitioners in the study did not have a marketing budget, and only 31 percent of firms of 2-9 lawyers had one. 

Therefore, excessive advertising isn’t universal across the legal industry, and the saturation of advertising channels can more likely be attributed to large firms reaping substantial profits from certain practice areas or firms bolstered by third-party litigation financing. In many instances, both of these conditions factors may be involved. For example, data that ranks the leading legal services advertisers in the United States in 2023 by spending reveals a list dominated by large law firms and attorney conglomerates specializing in mass tort, accident, and personal injury litigation.

The Wall Street Journal reported earlier this year on the ties between advertising surge and the growth in mass product-liability and personal-injury cases, along with the rising involvement from a particular segment of the investment industry in these types of litigation. Nearly 800,000 television advertisements for mass tort cases ran in 2023, costing over $160 million. According to the WSJ, the ads shown most frequently that year included those soliciting individuals who might have been exposed to contaminated water at the Camp Lejeune Marine base. This particular mass tort ranks high on the previously mentioned list of top spenders.

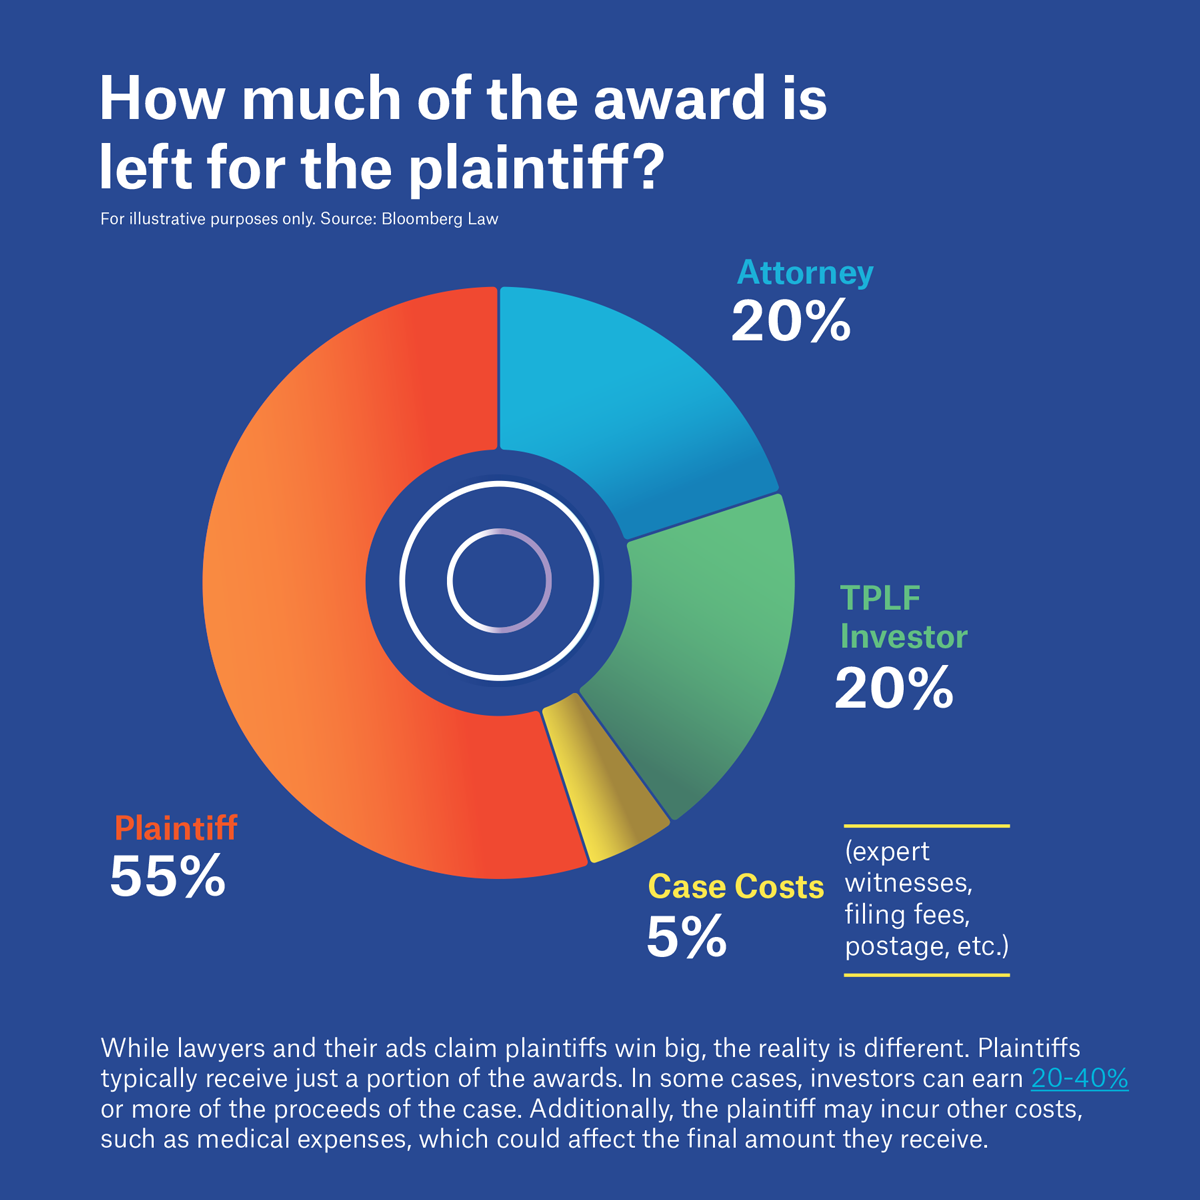
The average dollar amount of third-party litigation funder (TPLF) loans provided to individual law firms ranges from $20 million to $100 million. Given that prospective returns for TPLF loans reportedly reach as high as 20 percent for the riskier mass tort litigation, connecting the surge in advertising for recruiting plaintiffs to the TPLF cash stream may not be such a big leap. Yet, over the years, studies have shown that attorney involvement can increase claims costs and the time needed to resolve them, even while reducing value for claimants.

Insurance claims litigation is a growing concern in several states, including Georgia, Louisiana, and Florida, threatening coverage affordability and availability. In Georgia, for example, data indicates that auto coverage affordability for Georgians has been waning faster than in any other state. An August 2024 report, Personal Auto Insurance Affordability in Georgia, issued by IRC, ranked Georgia 47th in terms of auto insurance affordability, while the state tops the most recent list of places that the American Tort Reform Foundation (ATRF) believes judges in civil cases systematically apply laws and court procedures generally to the disadvantage of defendants.

Triple-I and key insurance industry stakeholders define legal system abuse as policyholder or plaintiff attorney practices that increase costs and time to settle insurance claims, including situations when a disputed claim could have been fairly resolved without judicial intervention. Insurers’ legal costs for claims can mount with the increasing number of lawsuit filings, extended litigation, and outsized jury awards (awards exceeding $10 million).

To join the discussion, register for JIF 2024. Follow our blog to learn more about trends in insurance affordability and availability across the property and casualty market.