Category Archives: Industry Financials

P&C Underwriting Profitability Prospects for 2024 Remain Firm

By William Nibbelin, Senior Research Actuary, Triple-I

The U.S. Property & Casualty insurance market is expected to continue its trajectory of improving underwriting results in 2024 into 2025 and 2026, according to the latest projections by actuaries at Triple-I and Milliman. The latest report – Insurance Economics and Underwriting Projections: A Forward View – was released during Triple-I’s January 16 members-only webinar.

Year-over-year gains in net written premium increases and quarter-over-quarter loss ratios are primarily due to better-than-expected Q3 performance in personal auto.

The 2024 underlying economic growth for P&C ended slightly below U.S. GDP growth at 2.3 percent versus 2.5 percent year over year. A further economic milestone occurred in 2024, with the number of people employed in the U.S. insurance industry surpassing three million.

Michel Léonard, Ph.D., CBE, chief economist and data scientist at Triple-I, noted P&C underlying economic growth is expected to remain above overall GDP growth in 2025 (2.3 percent versus 2.1 percent) and 2026 (2.6 percent versus 2.0 percent) as lower interest rates continue to revive real estate and contribute to higher volume for homeowners’ insurance and commercial property.

“This is an improvement on our 2025 P&C underlying growth expectations from second half of 2024,” Léonard said. “The pace of increase in P&C replacement costs is expected to overtake overall inflation in 2025 (3.3 percent versus 2.5 percent). This aligns with our earlier expectations from the second half of last year.”

Personal vs. commercial lines performance

The 2024 net combined ratio for the P&C industry is projected to be 99.5, a year-over-year improvement of 2.2 points, with a net written premium (NWP) growth rate of 9.5 percent. Combined ratio is a standard measure of underwriting profitability, in which a result below 100 represents a profit and one above 100 represents a loss. Personal lines 2024 net combined ratio estimates improved by nearly 1 point, while the commercial lines 2024 estimates worsened by 1.2 points.

Dale Porfilio, FCAS, MAAA, Triple-I’s chief insurance officer, expanded upon the dichotomy of commercial and personal lines results.

“Commercial lines continue to have better underwriting results than personal lines, but the gap is closing,” Porfilio said. “The impact from natural catastrophes such as Hurricane Helene in Q3 2024 and Hurricane Milton in Q4 2024 significantly impacted commercial property. The substantial rate increases necessary to offset inflationary pressures on losses have driven the improved results in personal auto and homeowners.”

Personal auto and homeowners are each projected to have improved 6.1 points over 2023, with a 2024 net combined ratio of 98.8 and 104.8, respectively. NWP growth rate for personal lines is expected to surpass commercial lines by 9 points in 2024, with personal auto leading at 14.0 percent, the second highest in over 15 years.

Jason B. Kurtz, FCAS, MAAA, a principal and consulting actuary at Milliman – a premier global consulting and actuarial firm – elaborated on profitability concerns within commercial lines.

“Commercial auto continues to remain unprofitable,” he said. “The 2024 direct incurred loss ratio through Q3 is only marginally improved relative to 2023 and is the second highest in over 15 years.”

Hurricane Milton is projected to be the worst catastrophic event for commercial property since Hurricane Ian in 2022 Q3, driving higher-than-expected losses and subsequently increasing the commercial property projected 2024 net combined ratio up 3.3 points to 91.2, which is also 3.3 points worse than 2023. During the webinar, commercial property forecasts were also shared for the fire and allied and inland marine sub-lines.

Continued worsening in general liability

General liability’s projected 2024 net combined ratio of 103.7 is 3.6 points worse than actual 2023 experience. Kurtz said the line has seen significantly worsening, with each quarterly loss ratio in 2024 worse than 2023 year over year.

“The 2024 direct incurred loss ratio through Q3 is the highest in over 15 years,” Kurtz said. “As a result, we have increased our expectations for 2025 and 2026 net written premium growth, as the industry responds to the worsening 2024 performance.”

Continuing the discussion on general liability, Emma Stewart, FIA, chief actuary at Lloyds added that U.S. general liability has experienced material deterioration in loss ratios and a slowing down of claims development.

“A large driver of this has been the post-underwriting emergence of heightened social inflation, or more specifically, legal system abuse and nuclear verdicts,” Stewart said. “If these trends continue to increase, reserves on this class can be expected to deteriorate further.”

Workers comp loss-cost preview

Ending with workers compensation, Donna Glenn, FCAS, MAAA, chief actuary at the National Council on Compensation Insurance, provided a preview of this year’s average loss-cost changes and discussed the long-term financial health of the workers compensation system. 

“The 2025 average loss cost decrease of 6 percent is moderate, which will inevitably have implications on the overall net written premium change,” Glenn said.  She added that the –6 percent average loss cost level change in 2025 is notably different than the -9 percent average seen in 2024, the largest average decrease since before the pandemic.

“Payroll for 2025 will develop throughout the year resulting from both wage and employment levels.  Therefore, overall premium will become clearer as the year progresses,” she said.

Inflation Continues
to Drive Up Consumers’ Insurance Costs

By William Nibbelin, Senior Research Actuary, Triple-I

Insurance is priced to reflect the underlying risk of every policy. When more claims are filed and the average amount paid of those claims increases, insurance becomes more expensive. A measure of underwriting profitability for insurance carriers is the combined ratio calculated as losses and expense divided by earned premium plus operating expenses divided by written premium. A combined ratio over 100 represents an underwriting loss. When expected losses increase, an insurance carrier must increase premiums by raising rates to maintain a combined ratio under 100.

Commercial auto insurance has recorded a net combined ratio over 100 nine times out of 10 between 2014 and 2023, and, according to the latest forecasting report by Triple-I and Milliman, continues to worsen in 2024. According to the Triple-I Issues Brief, personal auto insurance has had a net combined ratio over 100 for the past three years, with a 2023 net written premium (NWP) growth of 14.3 percent, which was the highest in over 15 years.

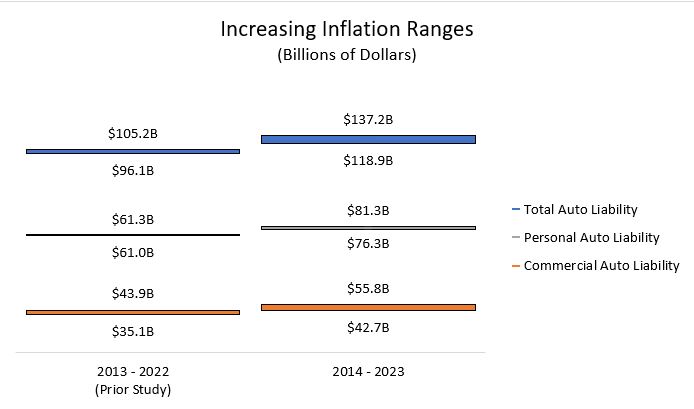
From 2014 through 2023 economic and social inflation added $118.9 billion to $137.2 billion in auto liability losses and defense and cost containment (DCC) expenses. This represents 9.9 percent to 11.5 percent of the $1.2 trillion in net losses and DCC for the period and an increase of 24 percent to 31 percent from the previous analysis on years 2013 through 2022.

A new study – “Increasing Inflation on Auto Liability Insurance – Impact as of Year-end 2023” – is the fourth installment of research on the impact of economic and social inflation on insurer costs and claim payouts. Compared to the prior study, Commercial Auto Liability loss and DCC is 20.7 percent to 27.0 percent ($43 billion to $56 billion) higher due to increasing inflation. Personal auto liability loss and DCC is 7.7 percent to 8.2 percent ($76 billion to $81 billion) higher from increasing inflation.

Key Takeaways

  • The compound annual impact of increasing inflation ranges from 2.2 percent to 2.9 percent for commercial auto liability, which is higher than the personal auto liability estimate of 0.7 percent. However, the impact of increasing inflation from a dollar perspective is much higher for personal auto liability compared to commercial auto liability. This is due, in part, to the underlying size of the line of business.
  • Frequency of auto liability claims per $100 million GDP for 2023 is unchanged for commercial auto liability and lower for personal auto liability compared to 2020, when frequency dropped at the onset of the COVID-19 pandemic for both lines.
  • Severity of auto liability claims continues to increase year over year and has increased more than 70 percent from 2014 to 2023 for both lines.

Researchers Jim Lynch, FCAS, MAAA, Dave Moore, FCAS, MAAA, LLC, Dale Porfilio, FCAS, MAAA, Triple-I’s chief insurance officer, and William Nibbelin, Triple-I’s senior research actuary used a similar methodology as prior studies. Loss development patterns were used to identify inflation for selected property/casualty lines in excess of inflation in the overall economy. The new study extends the model with annual statement data through year-end 2023.

Commercial Auto Liability

The prior study indicated claim severity (size of losses) had risen 72 percent overall from 2013 to 2022, with the median annual increase at 6.3 percent. The new study indicates an additional annual increase of 6.6 percent from 2022 to 2023. The report compares the compound annual growth rate of 6.6 percent from 2014 through 2023 to the compound annual increase in the consumer price index (CPI) of 2.8 percent during this same time. With a flat frequency trend combined with an increasing severity trend in recent years for commercial auto liability, this comparison calls out the higher inflation faced by insurers beyond just general inflation trends.

Personal Auto Liability

While replacement costs remain flat to negative providing relief to personal auto physical damage, personal auto liability represents approximately 60 percent of the overall personal auto line. Similar to commercial auto liability – but slightly lower – claim severity for personal auto liability has increased at a compound annual rate of 6.3 percent from 2014 through 2023. However, unlike commercial auto liability, the frequency for personal auto liability has declined slightly in 2022 and 2023, with 85 claims per $100 million GDP in 2023 compared to 90 in 2022 and 100 in 2021.

Limitation of industry data

The report relies on industry data as reported by insurers to the National Association of Insurance Carriers (NAIC) and made available through different reporting suppliers, such as S&P Global Market Intelligence. As such, different individual inflationary elements – whether economic, social, or otherwise – cannot be determined using the underlying actuarial methodologies.

However, like prior studies the bulk of increasing inflation before 2020 is attributed to social inflation, while social inflation and economic inflation dominate increasing inflation together beginning in 2020.

Triple-I continues to foster a research-based conversation around social inflation as part of legal system abuse. For an overview of the topic and other helpful resources about its potential impact on insurers, policyholders, and the economy, check out our knowledge hub.

Personal Lines Underwriting Results Improve, Reducing Gap With Commercial Lines

The U.S. property and casualty insurance industry experienced better-than-expected economic and underwriting results in the first half of 2024, according to the latest forecasting report by Triple-I and Milliman.  The report was released during a members-only webinar on Oct. 10.

The industry’s estimated net combined ratio of 99.4 represented a 2.3-points year-over-year improvement, with commercial lines continuing to outperform personal lines. Combined ratio is a standard measure of underwriting profitability, in which a result below 100 represents a profit and one above 100 represents a loss. 

Much of the overall underwriting gain was due to growth in personal lines net premiums written. Commercial lines underwriting profitability remained mostly flat.

“The ongoing performance gap between personal and commercial lines remains, but that gap is closing,” said Triple-I Chief Insurance Officer Dale Porfilio. “The significant rate increases necessary to offset inflationary pressures on losses are driving the improved results in personal auto and homeowners. With that said, the impact of natural catastrophes such as Hurricanes Helene and Milton threaten the improved homeowners results and are a significant source of uncertainty.”

During the webinar Q&A period, Porfilio provided insight on the potential impact of Hurricane Milton on the Triple-I 2024 net combined ratio forecast during the Q&A portion. One key figure regarding potential catastrophe losses is the impact on the 2024 net combined ratio forecast of adding one additional billion dollars of catastrophe losses. Each additional billion dollars of catastrophe losses is an impact of one tenth of a percent on the forecast.

Triple-I has loaded an estimate for catastrophe losses for the second half of 2024 based on historical experience, trends, economic projections, etc. prior to Milton, so there is no expectation of needing to add $30 billion to $40 billion – the recent estimate published by Gallagher Re.

If there was a need to add an additional $30 billion in catastrophe losses, that would be a +3.0-point impact on the forecast.

The net combined ratio for homeowners insurance of 104.9 was a six-point improvement over first-half 2023.  The line is expected to achieve underwriting profitability in 2026, with continued double-digit growth in net written premiums expected in 2025.   

Personal auto’s net combined ratio of 100 is 4.9 points better than 2023. The line’s 2024 net written premium growth rate of 14.5 percent is the highest in over 15 years. 

Jason B. Kurtz – a principal and consulting actuary at Milliman – elaborated on profitability concerns within commercial lines. Commercial lines 2024 net combined ratio remained relatively flat at 97.1 percent. Improvements in commercial property, commercial multi-peril, and workers compensation were offset by continued deterioration in commercial auto and general liability.

“Commercial auto expectations are worsening and continue to remain unprofitable through at least 2026,” he said. “General liability has worsened and is expected to be unprofitable through 2026.”

Michel Léonard, Triple-I’s chief economist and data scientist, said P&C replacement costs are expected to overtake overall inflation in 2025.

“P&C carriers benefited from a ‘grace period’ over a few quarters during which replacement costs were increasing at a slower pace than overall inflation,” Dr. Léonard said. “That won’t be the case in 2025.”  

It’s not too late to register for Triple-I’s Joint Industry Forum: Solutions for a New Age of Risk. Join us in Miami, Nov. 19 and 20.

Economic & Actuarial Analyses Ensure Our
“Best Pick Is Our Last Pick”

By Lewis Nibbelin, Guest Blogger for Triple-I

Insurance underwriting and pricing require a clear view of loss experience and reliable economic projections. Today’s dynamic environment – marked by historically high inflation, climate-related risks, and regulatory constraints that vary widely by state – complicate such projections while making them more important than ever.

“Actuarial ratemaking is prospective in nature, but you have to look at history to be able to do that,” explained Dale Porfilio, Triple-I’s Chief Insurance Officer and President of the Insurance Research Council (IRC), in an interview for the All Eyes on Economics podcast. “A core part of that actuarial ratemaking is to say, ‘How are losses different? How have they trended? How are they going to grow?’”

Current economic uncertainty – particularly via rising replacement costs and high general inflation – presents a myriad of evolving factors many actuaries may struggle to contextualize.

“It just takes a while to get through the timeline of claims occurring and losses getting paid,” Porfilio told host and Triple-I Chief Economist and Data Scientist Dr. Michel Léonard. “We can already be in a cycle of increasing or decreasing inflation, and you won’t see it in losses yet… You’re going to see it faster from economic indicators than you’re going to see it in insurance.”

For economists and actuaries alike, projections are data-driven inferences. Using multiple data sources and various forms of sophisticated analysis all strengthen the precision of those inferences.

For example, IRC – like Triple-I, an affiliate of The Institutes – is developing a database that aggregates detailed personal auto injury claims information from numerous insurers. It encompasses five and a half years’ worth of data on not only the total claim payout, but the specific injuries and care within each claim file.

A database of this magnitude has the potential to help insurance carriers improve the accuracy of pricing and underwriting. More important, this research will help policymakers and carriers identify opportunities to reduce claim costs, which can improve the affordability of personal auto insurance.

Ultimately, synthesizing diverse perspectives reduces the role of luck for insurers when setting rates. 

Triple-I works to provide a “combined wisdom,” Porfilio said, through the quarterly Insurance Economics and Underwriting Projections: A Forward View, a joint report with Milliman. The report presents an underwriting projection model which – by using P/C replacement cost indices and economic growth data as leading indicators – is both actuarially and economically sound.

Understanding economic trends is crucial, but understanding how risk influences these trends is equally important. Ongoing geopolitical risk, for instance, continues to strain global supply chains, and integrating this information into underwriting projections is one way to build resilience against disruptions.

“Learning to speak as an economist or an actuary is another language,” Porfilio said, and resources such as Triple-I’s Chart of the Week serve to simplify the sharing of economic research for insurers and consumers.

This wealth of available data analysis ensures that “our best pick is our last pick,” Porfilio said. “We’re always putting our best answer on the page to share the best insights that we can…and educate and inform as wide of an audience as possible.”

The full interview is available now on Spotify, Audible, and Apple.

P/C Underwriting Profitability Remains
at Least a Year Away

By Max Dorfman, Research Writer, Triple-I

The property/casualty insurance industry is expected to achieve underwriting profitability in 2025, according to the latest research from the Triple-I and Milliman, a collaborating partner. The report, Insurance Economics and Underwriting Projections: A Forward View, which was presented at a members-only webinar on July 11, also projects a small underwriting loss in 2024.

Michel Léonard, Ph.D., CBE, chief economist and data scientist at Triple-I, discussed how P/C replacement costs continue to increase more slowly than overall inflation.

“For the last 12 months, economic drivers of insurance performance have been favorable to the industry, with P/C insurance’s underlying growth catching up to overall U.S. economic growth rates, and its replacement costs increasing at a sluggish pace compared to overall inflation,” Dr. Léonard said. “We expected this favorable window to last into 2025.”

That may not be the case anymore for two reasons, according to Léonard.

“First, U.S. economic growth slowed more than expected in Q1 2024, largely because of the Fed’s lack of clarity about the timing of interest rate cuts,” he said. “Second, global supply chains are again showing stress due to ongoing and increasing geopolitical risk, such as the tensions in and around the Suez Canal. These causes may be threatening to send inflation back toward pandemic-era levels. Geopolitical risk never left, and supply chains are on a lifeline.”

Dale Porfilio, FCAS, MAAA, Triple-I’s chief insurance officer, discussed the split between personal and commercial lines, noting that, “The ongoing performance gap between personal and commercial lines remains, but that gap is closing.”

 “This quarter, we are projecting commercial lines underwriting results to outperform personal lines premium growth by over five points in 2024,” Porfilio added. “The difference, in large part, illustrates how regulatory scrutiny on personal lines has curbed the ability for insurers to increase prices to reflect the significant amount of inflation that impacted replacement costs through and coming out of COVID.”

Jason B. Kurtz, FCAS, MAAA, a principal and consulting actuary at Milliman – a global consulting and actuarial firm – points out how commercial multi-peril is one line that continues to face long-term challenges.

“While the expected net combined ratio of 106.2 is one point better than 2023, matching the eight-year average, the line has not been profitable since 2015. And with a Q1 direct incurred loss ratio of 52 percent and premium growth rates continuing to slow, we see some improvement but continuing unprofitability through 2026,” Kurtz said.

In juxtaposition, Kurtz pointed out the continuing robust performance of workers’ compensation.

“The expected 90.3 net combined ratio is nearly a one-point improvement from prior estimates and would mark 10 consecutive years of profitability for workers’ comp,” he said. “We continue to forecast favorable underwriting results through 2026.”

“Medical costs are going up, but they have not experienced the same type of inflation as the broader economy,” added Donna Glenn, FCAS, MAAA, chief actuary at the National Council on Compensation Insurance (NCCI). NCCI produces the Medical Inflation Insights report, which provides detailed information specific to workers’ compensation on a quarterly basis. “Since 2015, both workers’ compensation severity and medical inflation, as measured by NCCI’s Workers’ Compensation Weighted Medical Price index, have grown at a similar rate, a quite moderate 2 percent per year.”

Other highlights of the report include:

  • Homeowners insurance underwriting losses expected to continue for 2024-2025, but the line is expected to become profitable in 2026, with continued double-digit net written premium growth for 2024-2025.
  • Personal auto net combined ratio improved slightly from prior estimates and is on track to achieve profitability in 2025.
  • Commercial lines 2024 net combined ratio remained unchanged despite shifts in commercial property (-1 point), workers’ compensation (-1 point), and general liability (+1 point).
  • Net written premium growth rate for personal lines is expected to continue to surpass commercial lines by over 8 percentage points in 2024.

Reinsurance Buyers See More Balanced Market at July 1 Renewals: Gallagher Re

Reinsurers experienced near-record returns in 2023, and continued to post strong results in the first quarter of 2024, with up to a 12% improvement in combined loss ratios, according to Gallagher Re’s 1st View report.

The report attributes these positive outcomes to several factors, including relatively benign natural catastrophe activity, adjustments in the reinsurance market, improved conditions in primary markets, and higher reinvestment rates. Improved results have created a more favorable market for reinsurance buyers, with sufficient capital available to meet increased demand, Gallagher Re observed.

“This more comfortable market for buyers has been underpinned by an increasing supply of capital to meet increased demand as reinsurers balance sheets have expanded on the back of strong 2023 and Q1 2024 results,” commented Gallagher Re CEO Tom Wakefield.

Non-life insurance-linked securities (ILS) capital reached a record level of $107 billion at the end of 2023 and continued to grow in the first half of 2024, driven by successful catastrophe bonds and increased investor interest.

However, ILS capacity became less abundant by midyear, as the Atlantic hurricane season approached,  Gallagher Re noted.

“ILS capacity became scarce as ILS investors were ‘unnerved’ by forecasts of an active hurricane season,” the report stated.

Property outlook

The property reinsurance market has experienced increased competitiveness and capacity due to reinsurers’ strong performance in recent years, the report noted.

While reinsurers were not significantly impacted by natural catastrophe losses in Q1, there were an estimated $43 billion of economic losses and $20 billion insured losses in Q1 with both numbers being near the 10-year average.

The first quarter is not traditionally a major driver of the annual natural catastrophe loss burden, historically only representing 14% of the full-year total. Losses in Q1 have been dominated by severe convective storm losses (34% of insured losses) and other secondary perils of wildfire, drought and flood making up another 29%.

At July 1 renewals, risk-adjusted catastrophe pricing for Florida property was down 0% to 10% on average, and additional capacity demands of $3 billion to $5 billion in Florida were all met.

“Following three consecutive years of double-digit risk-adjusted rate increases, reinsurers were looking to hold the line from a procing perspective,” the reinsurance intermediary said of the Florida property catastrophe market.

The report also highlighted that buyers of property catastrophe insurance have been able to negotiate better terms and conditions on their reinsurance contracts due to the “risk on” approach taken by reinsurers. Risk-adjusted catastrophe placements in the U.S. generally were down 0% to 12% at July 1, Gallagher Re reported.

Non-catastrophe property pricing in the U.S. was down 0 to 10% for loss free accounts, but up 5% to 15% with losses.

Casualty outlook

“Casualty underwriters appear less confident than property underwriters outlined above, although this warrants its own caveat. The issues driving stakeholder concerns are regionally nuanced as the frequency and severity of casualty losses are driven by local societal, economic, judicial, legislative, and behavioral factors,” the report stated.

In the casualty insurance sector, concerns over rate adequacy in the U.S. have increased, following adverse development reported by liability insurers in the fourth quarter of 2023 and the first quarter of 2024. The lengthening and deteriorating tail of liability claims have exacerbated reinsurers’ concerns, as the market is already dealing with economic and non-economic loss inflation.

At July 1 renewals, risk adjusted excess of loss rates for U.S. general liability business were up 5% to 10% with no losses, and up 5% to 15% with emerging losses.

For U.S. health care liability, increased loss severity was seen across the health care sector. Excess of loss rates were up 0 to 5% for limited-exposed layers, and up 3% to 8% for catastrophe layers, without emerging losses. Rate increases were greater — up 5% to 20% — for layers with emerging losses.

Professional liability lines with no emerging losses saw excess of loss rates decline 0% to 5%, while accounts with losses experienced 0% to 10% increases.

Workers compensation has seen continued pressure for increases, even on loss-free layers, Gallagher Re noted. Excess of loss rates with no loss emergence were up 0 to 5% and with loss emergence, increased 5% to 10% at July 1.

The full report can be downloaded on the Gallagher Re website.

Auto Insurers’ Performance Improves, But Don’t Expect Rates
to Flatten Soon

Several metrics that influence auto insurance premium rates are starting to improve, but it will take time for these improvements to be reflected in flattening rates, according to a recent Triple-I Issues Brief.

Direct premiums written and underwriting profitability improved dramatically in 2023.  Additionally, 2023 net written premium growth of 14.3 percent is the highest in over 15 years. These are great gains, but it’s important to remember that they come on top of results in 2022 that were the worst in recent years.

The number of drivers on the road and miles driven have returned to pre-pandemic levels – but the risky driving behaviors that led to high losses during the pandemic have not improved. More accidents with severe injuries and fatalities have driven up claims and losses in terms of both vehicle damage and liability, while attracting greater attorney involvement and legal system abuse. Compounding these conditions has been historically high inflation, which puts upward pressure on the material and labor costs, increasing the cost of claims.

Telematics technologies, which allow insurers to analyze risk profiles and tailor rates based on individual driving habits, offer the possibility of some relief. By providing feedback that can influence driving behavior, telematics has been shown to lower risk and help reduce the cost of insurance. An Insurance Research Council survey found 45 percent of drivers said they made significant safety-related changes in how they drove after participating in a telematics program. Another 35 percent said they made small changes.

But broader risk and economic factors are likely to keep premium rates high in most cases for the foreseeable future.

Personal Auto Line Propels Strong 1Q
P&C Insurance Results

Strong improvements in personal auto insurance results helped drive the U.S. property and casualty insurance industry to its second-highest net underwriting gain in any quarter since at least 2000, according to an S&P Global Market Intelligence analysis.

Just 12 months from its worst-on-record start to a calendar year – with a combined ratio of 102.2 – the industry generated a ratio of approximately 94.0. Combined ratio is a measure of underwriting profitability in which a ratio under 100 indicates a profit and one above 100 represents a loss.

While quarterly statutory data is insufficient to calculate combined ratios at the line-of-business level, S&P previously estimated that a direct incurred loss ratio of approximately 71.3 percent in the personal auto sector would have produced break-even underwriting results in the first quarter.

“Applying the same methodology to the first-quarter result of 66.7% yields an estimated combined ratio of 95.6,” S&P said. The industry’s full-year 2023 private auto combined ratio was 104.9.

On a consolidated basis across business lines, incurred losses increased only modestly, while net premiums earned continued to rise rapidly. This reflects the combination of continued top-line strength in many commercial lines of business and what S&P called “the hardest private auto pricing environment in 47 years.”

The industry also benefited from relatively mild catastrophe activity compared with the comparable prior-year period.

While these strong first-quarter results are noteworthy, it will take time to know whether they represent the start of a trend. Multiple severe convective storm events already have occurred in the second quarter, and the 2024 Atlantic hurricane season is forecast to be “extremely active.”

Personal auto’s recent improvements follow 2022 results that were among the worst in recent years.  The number of drivers on the road has returned to pre-pandemic levels, and the risky driving behavior that led to high losses during the pandemic has not improved. More accidents with severe injuries and fatalities have driven up claims and losses in terms of both vehicle damage and liability, attracting greater attorney involvement and legal system abuse.

Compounding these loss drivers has been historically high inflation, which puts upward pressure on the material and labor costs for both the auto and property lines.

Favorable first-quarter results are good news, but it’s important for policyholders and policymakers to remember that the current hard market wasn’t created overnight. It will take time for insurers’ performance and drivers’ rates to stabilize.

Triple-I/Milliman: Personal Lines Drag
on Underwriting Profitability Continues

By Max Dorfman, Research Writer, Triple-I

The property and casualty insurance industry posted its second consecutive year of underwriting losses, driven primarily by personal lines, according to the latest industry underwriting projections by actuaries at Triple-I and Milliman.

The net combined ratio for 2023 was 101.6, according to Insurance Economics and Underwriting Projections: A Forward View, a Triple-I members-only webinar. Combined ratio is a standard measure of underwriting profitability, in which a result below 100 represents a profit and one above 100 represents a loss. 

The newest results are an improvement from 2022. Additionally, premium growth is expected to further improve underwriting results in 2024, with the 2024 industry net combined ratio forecast at 100.2.

Michel Léonard, PhD, CBE, Triple-I’s chief economist and data scientist, discussed how P&C replacement costs are increasing more slowly than the consumer price index (CPI).

“P&C replacement costs benefited from greater deceleration of key CPI components, such as construction material and used auto costs,” he said. “We expect this trend to continue until early 2026.”

Léonard noted that personal and commercial auto replacement costs decreased in the first four months of 2024, continuing their 2023 trend, largely due to double-digit declines in used auto prices.

“Even homeowners’ replacement cost changes – the segment subject to some of the highest replacement cost increases over the past few years – is now lower than overall CPI,” Léonard said.

Dale Porfilio, FCAS, MAAA, Triple-I’s chief insurance officer, discussed the overall P&C industry underwriting projections and premium growth.

“The overall picture from prior quarters remains the same with commercial lines performing better than personal, but to a lesser extent,” Porfilio said.

The 2023 commercial lines net combined ratio was 96.2, 1.4 points worse than the 2022 result. While still unprofitable, personal lines improved 3.2 points relative to 2022. For 2023, the personal lines expense ratio improved by almost 2 points over 2022, most dramatically in personal auto. The net written premium growth rate for personal lines surpassed commercial lines by over 7 points in 2023.

“Continued personal lines premium growth should lead to further convergence in underwriting performance in 2024,” Porfilio said.

Jason B. Kurtz, FCAS, MAAA, a principal and consulting actuary at Milliman – a global consulting and actuarial firm – said that for commercial auto, the 2023 net combined ratio of 109.2 is 3.8 points higher than 2022, and 10.3 points higher than 2021​. 

“The improved underwriting results following the COVID-19 pandemic appear to have been short-lived, as the commercial auto underwriting results have once again deteriorated and adverse prior year development has returned to pre-COVID levels,” Kurtz said.

Looking at the workers compensation line, Kurtz noted that the 2023 net combined ratio of 87.3 is nearly identical to 2022 and the second lowest in over 15 years​. 

“2023 net written premium growth rate of 1 percent is expected to increase to 2 percent in 2024 and remain at that level of growth through 2026,” Kurtz said. “Favorable underwriting results are expected for our forecast horizon​, which in turn will dampen premium growth going forward.”

Donna Glenn, FCAS, MAAA, chief actuary at the National Council on Compensation Insurance (NCCI), said the workers comp system is in a period of extraordinary performance. 

“WC leads the P&C industry with the lowest combined ratio compared to all other lines of business,” Glenn said. 

Further highlighting the strong results, she said, 2023 is the tenth straight year of underwriting gains and seventh consecutive year with combined ratios under 90.

Calif. Risk/Regulatory Environment Highlights Role of Risk-Based Pricing

Even as California moves to address regulatory obstacles to fair, actuarially sound insurance underwriting and pricing, the state’s risk profile continues to evolve in ways that underscore the importance of risk-based insurance pricing and investment in mitigation and resilience.

Triple-I’s latest “State of the Risk” Issues Brief discusses this changing risk environment and the impact of Proposition 103 – a three-decades-old measure that has made it hard for insurers to profitably write coverage in the state. In a dynamically evolving risk environment that includes earthquakes, drought, wildfire, landslides, and — in recent years, due to “atmospheric rivers” — damaging floods, Proposition 103 has prevented insurers from using the most current data and advanced modeling technologies. Instead, it has required them to price coverage based on historical data alone.

It also has restricted accurate underwriting and pricing by not allowing insurers to incorporate the cost of reinsurance into their pricing. Insurers use reinsurance to maximize their capacity to write coverage, and reinsurance rates have been rising for many of the same reasons as primary insurance rates. If insurers can’t reflect reinsurance costs in their pricing – particularly in catastrophe-prone areas – they must pay for these costs from policyholder surplus, reduce their market share in the state, or do both.

Proposition 103 also has impeded premium rate changes by allowing consumer advocacy groups to intervene in the rate-approval process. This makes it hard to respond quickly to changing market conditions, resulting in approval delays and rates that don’t accurately reflect current (let alone future) risk. It also drives up legal and administrative costs.

This has led, in some cases, to insurers deciding to limit or reduce their business in the state. With fewer private insurance options available, more Californians are resorting to the state’s FAIR Plan, which offers less coverage for a higher premium.

This isn’t a tenable situation.

In September 2023, California Insurance Commissioner Ricardo Lara announced a Sustainable Insurance Strategy for the state that includes allowing insurers to use forward-looking risk models that prioritize wildfire safety and mitigation and include reinsurance costs into their premium pricing. In exchange, insurers must cover homeowners in wildfire-prone parts of the state at 85 percent of their statewide coverage.

Issues around property insurance affordability are not confined to California. They’ve been a long time in the making, and they won’t be resolved overnight.

“Any sustainable solutions will have to rest on actuarially sound underwriting and pricing principles,” the Triple-I brief says. “Unfortunately, too often, the public discourse frames the risk crisis as an `insurance crisis’ – conflating cause with effect. Legislators, spurred by calls from their constituents for lower insurance premiums, often propose measures that would tend to worsen the problem because these proposals generally fail to reflect the importance of accurately valuing risk when pricing coverage.”

California’s Proposition 103 and the federal flood insurance program prior to its Risk Rating 2.0 reforms are just two examples, according to Triple-I.

Learn More:

Triple-I Issues Brief: Wildfire

Triple-I Issues Brief: Flood

Triple-I Issues Brief: Risk-Based Pricing of Insurance

How Proposition 103 Worsens Risk Crisis in California

Is California Serious About Wildfire Risk?

Dear California: As You Prep for Wildfire, Don’t Neglect Quake Risk