By Max Dorfman, Research Writer, Triple-I
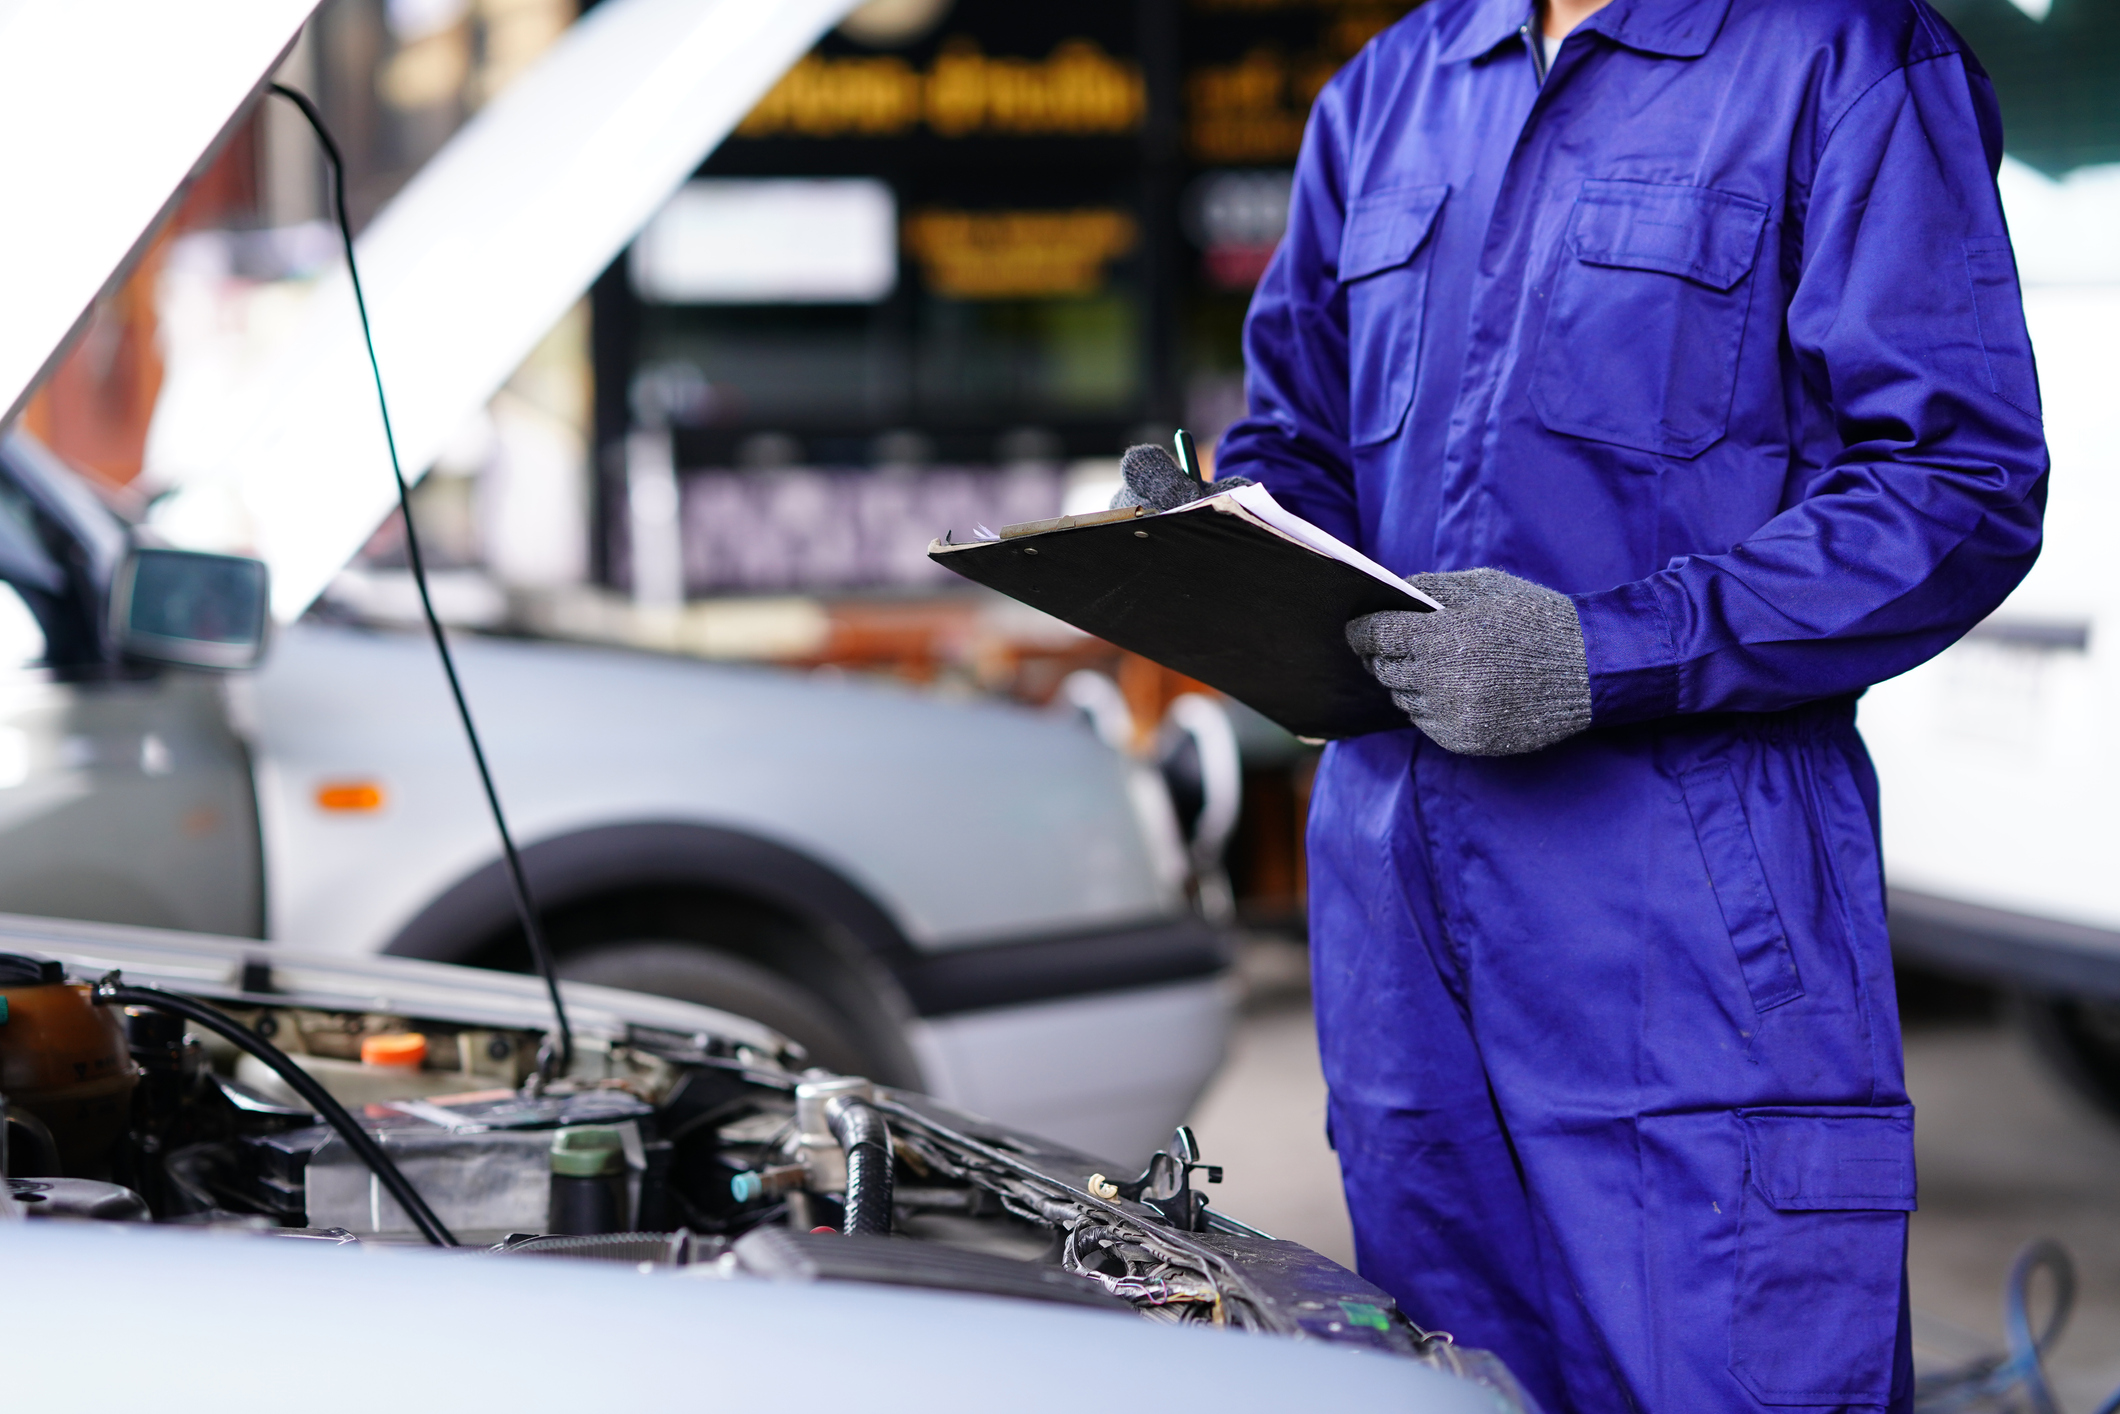
Auto premiums continue to increase as rising labor and material prices, alongside natural disasters, are forcing insurers to contend with significant losses.
As Triple-I previously found in its January report, Insurance Economics and Underwriting Projections: A Forward View, “commercial auto underwriting losses continue, with a projected 2023 net combined ratio of 110.2, the highest since 2017,” according to Jason B. Kurtz, FCAS, MAAA, a Principal and Consulting Actuary at Milliman. Combined ratio is a standard measure of underwriting profitability, in which a result below 100 represents a profit and one above 100 represents a loss.
Insurers are now having to increase rates in response to losses that are expected to keep rising.
“Nobody wants to have that higher-price bill,” said Sean Kevelighan, Triple-I’s CEO. However, he added companies “need to price insurance according to the risk level that’s out there.”
While inflation is partially to blame for these increases, natural disasters are also contributing to rising costs—and not only in traditionally disaster-prone areas like Florida and California.
As the overall P&C industry has struggled with severe convective storms, hurricanes, and other natural disasters, these losses have also been felt in commercial auto. In fact, 2023 witnessed around two dozen U.S. storms, each with losses of around a billion dollars or more. This included major lightning, hail, and damaging winds around many areas of the of the U.S.
“While a lot of these storms don’t make national headlines, they do tend to be very costly at the local level,” says Tim Zawacki, principal research analyst for insurance at S&P Global Market Intelligence. “And the breadth of where these storms are occurring is something that I think the industry is quite concerned about.”
While disasters and economic inflation continue to roil commercial auto, so too does social inflation. As the Triple-I previously reported, “social inflation,” which is the presence of inflation in excess of economic inflation, has also significantly contributed to increases in commercial auto premiums.
Triple-I found that “from 2013 to 2022, increasing inflation drove losses up by between $35 billion and $44 billion, or between 19 percent and 24 percent. The pandemic brought significant change to commercial auto liability, decreasing claim frequency while increasing claim severity more dramatically.”
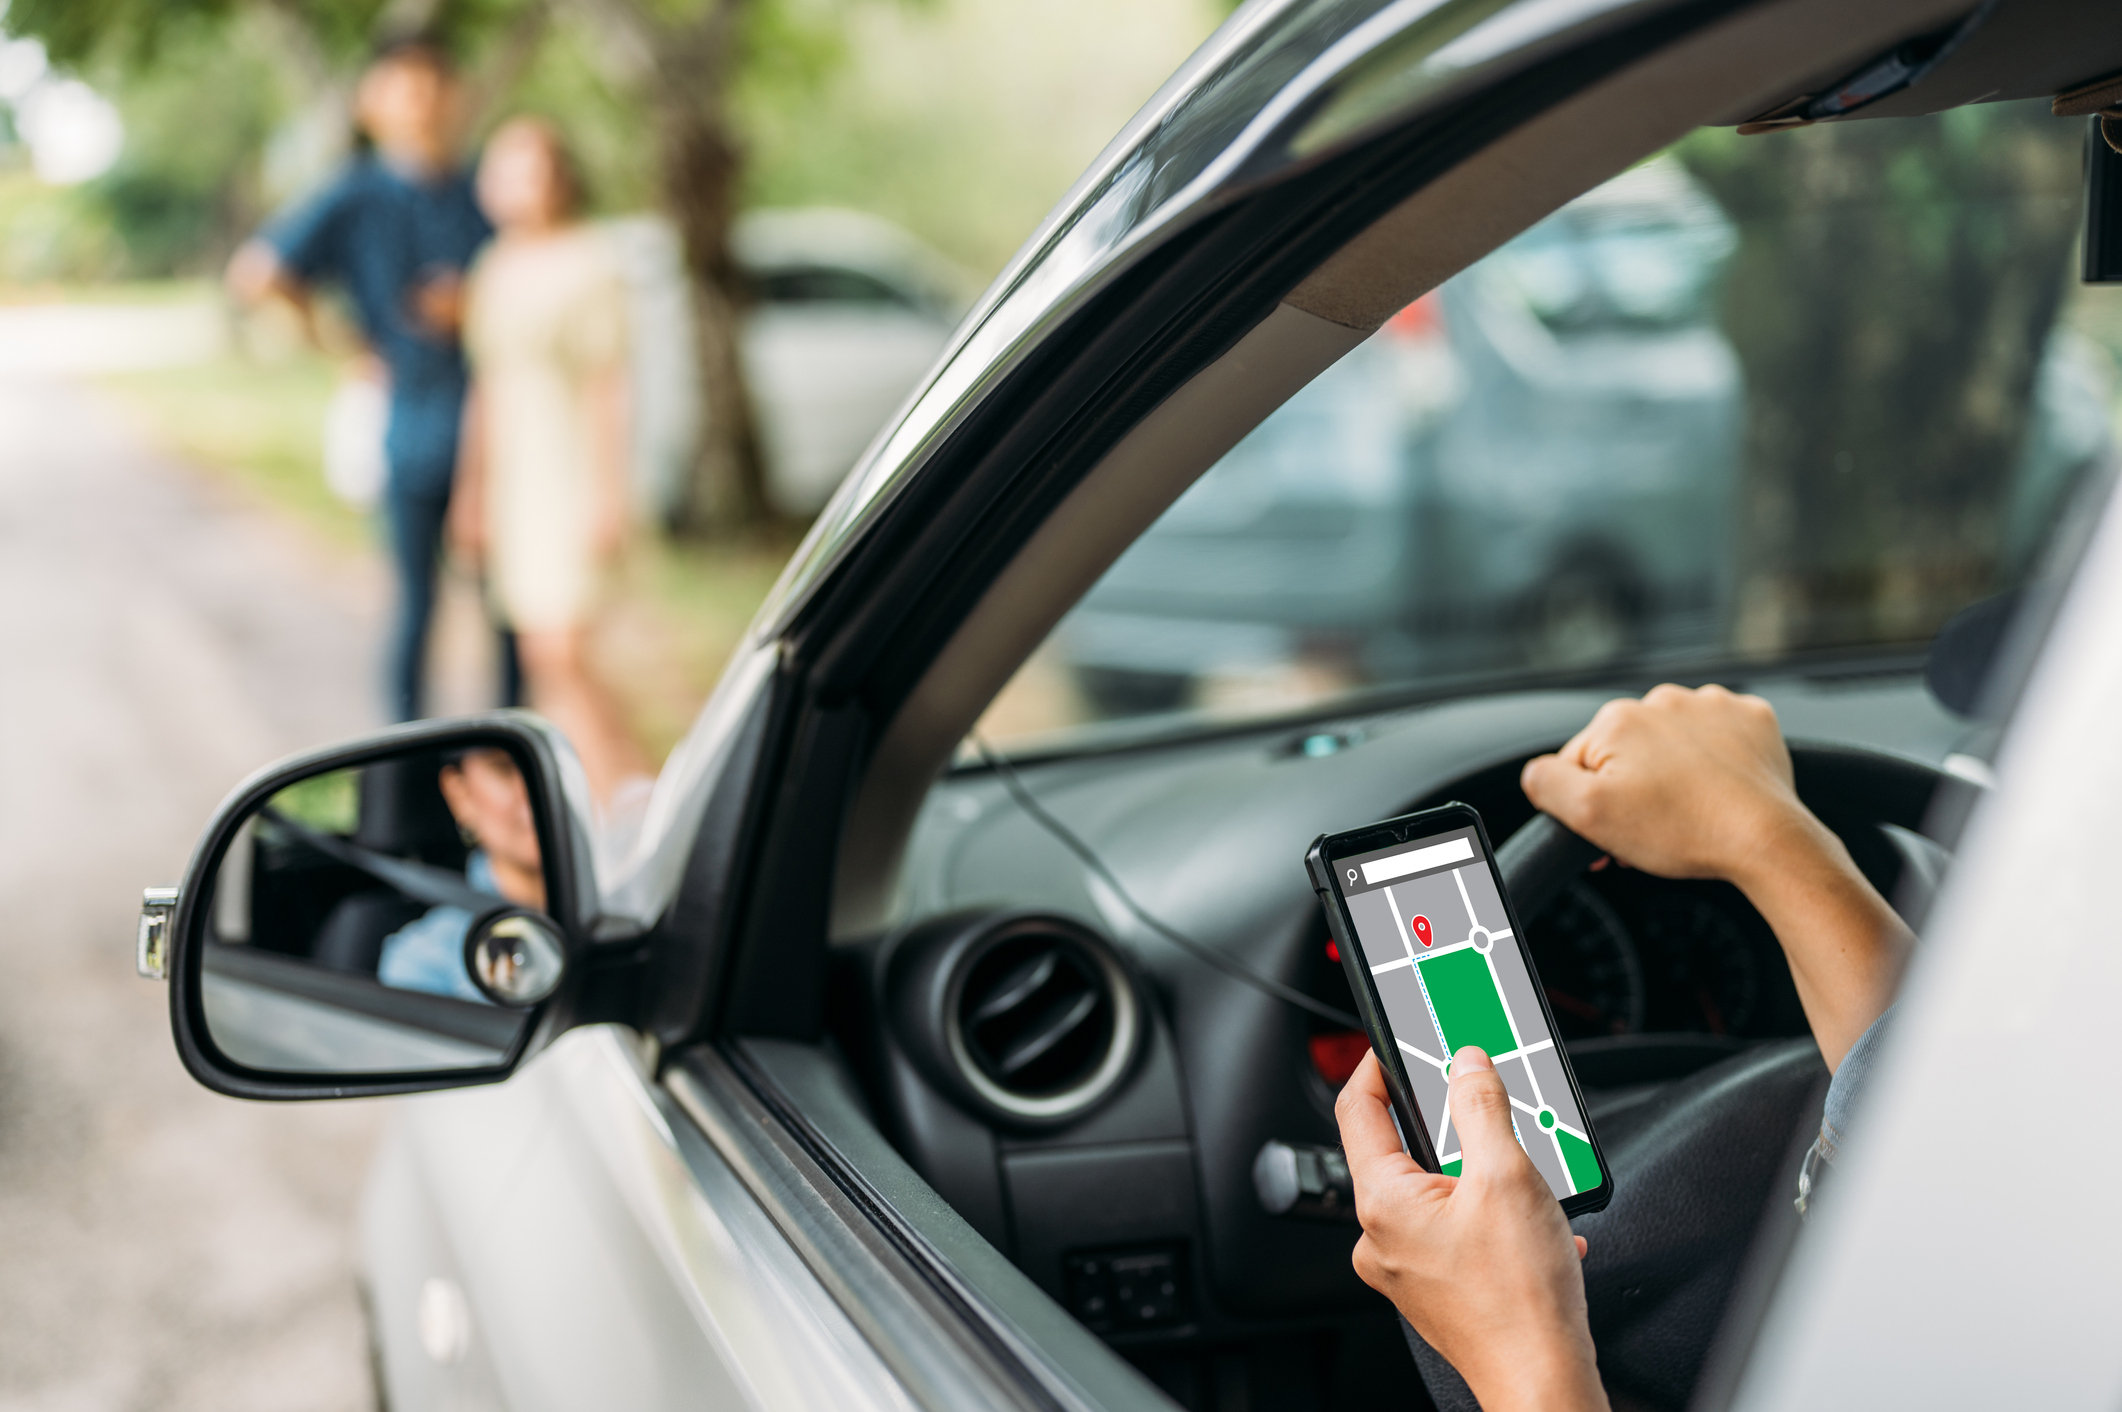
This increased claim severity is at least partially due to changing driving patterns since the pandemic, including distracted driving, which involves behaviors like cellphone use while behind the wheel. A Triple-I Issues Brief, Distracted Driving: State of the Risk, enumerated these concerns, which have undoubtedly played a role in rising commercial auto premiums.
Indeed, a confluence of issues are playing into rising auto premiums. While natural disasters are out of the control of insurance providers and their policyholders, other factors must be addressed to steady the cost of this line of insurance. This includes telematics and usage-based insurance, which has gained more acceptance since the pandemic.
Still, it is incumbent on insurers, policyholders, and policymakers to create a more sustainable market for auto insurance, working together to tackle the challenges of both climate risk and dangerous driving behavior.