Category Archives: Auto Insurance

“A.I. Take the Wheel!” Drivers Put Too Much Faith in Assist Features, IIHS Survey Suggests

Too many car owners are too comfortable leaving their vehicles’ driver-assist features in charge, potentially putting themselves and others at risk, according to the Insurance Institute for Highway Safety (IIHS).

IIHS said a survey of about 600 regular users of General Motors Super Cruise, Nissan/Infiniti ProPILOT Assist, and Tesla Autopilot found they were “more likely to perform non-driving-related activities like eating or texting while using their partial automation systems than while driving unassisted.”

“The big-picture message here is that the early adopters of these systems still have a poor understanding of the technology’s limits,” said IIHS President David Harkey.

The study reports that 53 percent of Super Cruise users, 42 percent of Tesla Autopilot users, and 12 percent of Nissan’s ProPilot Assist users were comfortable letting the system drive without watching what was happening on the road. Some even described being comfortable letting the vehicle drive during inclement weather.

These systems combine adaptive cruise control and lane-keeping systems, primarily to keep a car in a lane and following traffic on the highway. All require an attentive human driver to monitor the road and take full control when called for.

“None of the current systems is designed to replace a human driver or to make it safe for a driver to perform other activities that take their focus away from the road,” IIHS said in announcing the results of its survey.

While all three automakers caution drivers about the systems’ limits, confusion remains. Tesla’s driver-assist system, which it calls “full self-driving” has received much scrutiny over the years as auto safety experts say the name is misleading and risks worsening road safety.

The U.S.government has set no standards for these features, which are some of the newest technologies on vehicles today. A patchwork of state laws and voluntary federal guidelines is attempting to cover the testing and eventual deployment of autonomous vehicles in the United States. 

Learn More:

Background on: Self-driving cars and insurance

Kia, Hyundai Vehicles Stolen at Record Rates

Max Dorfman, Research Writer, Triple-I

Bargain-priced Kia and Hyundai vehicles have begun being targeted for theft at rates similar to muscle cars and SUVs, the Highway Loss Data Institute (HLDI) has reported, based on an analysis of 2021 insurance claims. The spike is due, in part, to the fact that the models being stolen don’t have electronic immoblizers that stop thieves from bypassing the ignition.

“Car theft spiked during the pandemic,” said Matt Moore, HLDI senior vice president. “These numbers tell us that some vehicles may be targeted because they’re fast or worth a lot of money and others because they’re easy to steal.”

Ignition immobilizers are standard equipment on almost all vehicles of that vintage made by other companies. They were standard on 62 percent of models of other manufacturers in model year 2000. By model year 2015, immobilizers were standard on 96 percent of other vehicles, but were only standard on 26 percent of Hyundai and Kia vehicle models.

“If it doesn’t have an immobilizer, it does make it somewhat easier to steal,” said Darrell Russell, a former auto theft investigator who is now director of operations, vehicles, at the National Insurance Crime Bureau (NICB).

In Wisconsin, which was affected by these thefts earlier than most, losses from Hyundai-Kia thefts grew more than 30 times from the 2019 level.

Motor vehicle theft continues to be a major issue

In 2020, the FBI found that $7.4 billion was lost to motor vehicle theft, with the average dollar loss per theft at $9,166. A total of 810,400 vehicles were stolen that year. The number of vehicles stolen was up 11.8 percent in 2020, from 724,872 in 2019. The NICB says the pandemic, economic downturn, loss of juvenile outreach programs, and public safety budgetary and resource limitations were key factors in the increase of motor vehicles stolen in 2020.

Preventive measures are important

The NICB recommends a layered approach to prevent vehicles from being stolen that includes:

  • Always locking your doors and removing your keys from the ignition;
  • Using visible or audible devices, like alarms and steering column brake locks;
  • Installing a vehicle immobilizer, like a kill switch or smart key; and
  • Investing in a tracking system.

Chubb Study Parses Insurance-Buying Behavior By Generation

Millennial and Generation Z consumers are more likely than Baby Boomers or Gen-Xers to seek insurance advice from an agent or broker, according to recent findings by Chubb.

The Chubb study explores attitudes about insurance-related matters across five generations of affluent and high net worth consumers in the U.S. and Canada. Its findings reveal differences in:

  • How each generation searches for and purchases insurance;
  • What they look for in an insurance carrier;
  • Their current coverages;
  • The kinds of media they trust most; and
  • How they currently engage with insurance agents.

Majorities of Gen Z and Millennial respondents (53 percent for both) appreciate having their agent or broker educate them on how insurance products and services can match their long-term goals, compared with about 40 percent each for Gen X and Baby Boomers. Unsurprisingly, the study also found that younger generations are more likely to use social media reviews when choosing an agent or broker to advise them. Most Gen Z (94 percent) and Millennial (89 percent) respondents said they rely on social media reviews, compared with 64 percent for Gen-Xers and 56 percent for Baby Boomers.

This quantitative study was being released in conjunction with additional research that agents and brokers can use to tailor their engagement with each of these generations to build greater trust, connection and credibility.

“It’s critical in today’s competitive business environment that we understand the dynamics of catering to different generations, with each evaluating and purchasing insurance very differently,” said Ana Robic, vice president, Chubb Group and Division President, Chubb North America Personal Risk Services. “We encourage our distribution partners to dive into what we’ve made available – and along with us – harness these insights to meet the unique risk management needs of our mutual clients across generations.” 

Matching Price to Peril Helps Keep Insurance Available & Affordable

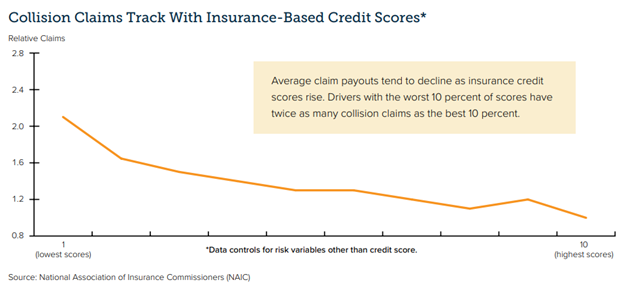
Setting insurance prices based on the risk being assumed seems a straightforward concept. If insurers had to come up with a single price for coverage without considering specific risk factors – including likelihood of having to submit a claim – insurance would be inordinately expensive for everyone, with the lowest-risk policyholders subsidizing the riskiest.

Risk-based pricing allows insurers to offer the lowest possible premiums to policyholders with the most favorable risk factors, enabling them to underwrite a wider range of coverages, thus improving both availability and affordability of protection.

Complications arise when actuarially sound rating factors intersect with other attributes in ways that can be perceived as unfairly discriminatory. For example, concerns have been raised about the use of credit-based insurance scores, geography, home ownership, and motor vehicle records in setting home and car insurance premium rates. Critics say this can lead to “proxy discrimination,” with people of color in urban neighborhoods sometimes charged more than their suburban neighbors for the same coverage. Concerns also have been expressed about using gender as a rating factor.

Triple-I has published a new Issues Brief that concisely explains how risk-based pricing works, the predictive value of rating factors, and their importance in keeping insurance affordable while enabling insurers to maintain the funds needed to keep their promises to policyholders. Integral to fair pricing and reserving are the teams of actuaries and data scientists who insurers hire to quantify and differentiate among a range of risk variables while avoiding unfair discrimination.

“There is no place in today’s insurance market for unfair discrimination,” the brief says. “In addition to being illegal, discrimination based on any factor that doesn’t directly affect the insured risk would be bad business in today’s diverse society.”

Learn More:

Bringing Clarity to Concerns About Race in Insurance Pricing

Delaware Legislature Adjourns Without Action on Banning Gender as Auto Insurance Factor

Triple-I: Rating-Factor Variety Drives Accuracy of Auto Insurance Ratings

Auto Insurance Rating Factors Explained

Personal Auto Insurers’ Losses Keep RisingDue to Multiple Factors

Nearly all the largest U.S. personal auto insurers reported poor financial results in the second quarter of 2022, according to an S&P Global Market Intelligence analysis. Several issues contributed to this trend and are putting upward pressure on premium rates as insurers’ loss ratios grow. The loss ratio is the percentage of each premium dollar an insurer spends on claims.

The factors driving negative auto insurer economic performance include:

  • Rising insurer losses due to increasing accident frequency and severity;
  • More fatalities and injuries on the road, leading to increased attorney involvement in claims;
  • Continuing supply-chain issues, leading to rising costs for autos, auto replacement parts, and labor; and
  • More costly auto repairs due to safer, more technologically sophisticated vehicles.

“The private auto business, besieged by the impact of inflation on vehicle repair and replacement costs, swung to a combined ratio of nearly 101.5 percent in 2021 from 92.5 percent in 2020 and 98.8 percent in 2019,” S&P reports. Combined ratio represents the difference between claims and expenses paid and premiums collected by insurers. A combined ratio below 100 represents an underwriting profit, and a ratio above 100 represents a loss. “After the private auto business nearly brought the industry to the brink of breakeven in 2021, we project that it will push the overall combined ratio into the red in 2022.”

At the beginning of the pandemic in 2020, auto insurers – anticipating fewer accidents amid the economic lockdown – gave back approximately $14 billion to policyholders in the form of cash refunds and account credits. While insurers’ personal auto loss ratios fell briefly and sharply in 2020, they have since climbed steadily to exceed pre-pandemic levels.

With more drivers returning to the road in 2022, this loss trend is expected to continue. The severity of the post-pandemic riskiness of U.S. highways is illustrated by the fact that traffic deaths – after decades of decline – have increased in the past several years due to more drivers speeding, driving under the influence, or not wearing seat belts during the pandemic. In 2021, U.S. traffic fatalities reached a 16-year high, with nearly 43,000 deaths. 

“When everyday life came to a halt in March 2020, risky behaviors skyrocketed and traffic fatalities spiked,” said National Highway Traffic Safety Administration (NHTSA) administrator Steven Cliff.  “We’d hoped these trends were limited to 2020, but, sadly, they aren’t.”

This year, NHTSA estimates, 9,560 people died in motor vehicle crashes between January and March, up 7 percent from the same period in 2021, making it the deadliest first quarter since 2002. 

Auto insurers also must contend with cost factors beyond what is occurring on the nation’s roadways. A recent auto insurance affordability study published by the Insurance Research Council (IRC) highlights the role of attorney involvement in driving up insurer expenses – and, ultimately, policyholder premiums – in the states where auto coverage is least affordable. As attorney involvement tends to be more prevalent in claims cases involving bodily injury, the NHTSA numbers are important for understanding upward pressure on auto insurance premium rates.

The IRC – like Triple-I, an affiliate of The Institutes – also points out that consumer spending on auto insurance has grown more slowly over the past 30 years than median household income, at least through year-end 2019 (see chart below).

In a society as dependent as ours is on access to transportation, availability and affordability of auto insurance are important components of overall consumer expenses. Triple-I will continue to report on trends in this important line.

Learn More:

 IRC Releases State Auto Insurance Affordability Rankings

Cellphone Bans Cut Crashes; Telematics Can Help Reduce Distracted Driving

2022 P&C Underwriting Profitability Seen Worsening as Inflation, Hard Market Persist

Pot Legalization Link to Car Crashes Varies by State, Study Finds

Delaware Legislature Adjourns Without Action on Banning Gender as Auto Insurance Factor

IRC Study: Public Perceives Impact of Litigation on Auto Insurance Claims

Distracted Driving Surges Since Start of Pandemic

IRC Releases StateAuto InsuranceAffordability Rankings

Louisiana, Florida, and Michigan are the three least affordable states for personal auto insurance, according to a new report by the Insurance Research Council (IRC). The three most affordable states, IRC finds, are Hawaii, New Hampshire, and North Dakota.

The state-by-state affordability rankings by IRC – like Triple-I, an affiliate of The Institutes – are based on insurance expenditures as a share of median household income. The report draws on data from the National Association of Insurance Commissioners (NAIC), which are only available up to 2019 and, therefore, don’t reflect more recent circumstances, such as the pandemic and the inflationary impact of supply-chain disruptions and the war in Ukraine.

Before these events, auto insurance nationwide had been becoming more affordable since the 1990s, when premiums as a percentage of median household income averaged 1.9 percent.  By the 2010s, it had decreased to 1.6 percent, and, in 2019, that figure stood at 1.56 percent.

During this 30-year period, median household income grew 2.9 percent annually.

Affordability varies dramatically by state, with Hawaii coming in as the most affordable, with expenditures standing at 0.95 percent of income. The least affordable state is Louisiana, with the average expenditure-to-income ratio more than three times higher, at 3.01 percent.

The report notes that attempts to reduce these costs must focus on key cost drivers, including accident frequency, repair costs, injury claim relative frequency, injury claim severity, medical utilization, attorney involvement, claim abuse, uninsured motorists, and litigation climate.

Looking ahead

Pandemic and post-pandemic riskiness of U.S. highways could also impact future affordability trends.  After decades of decline, U.S. traffic deaths have increased in the past several years due to more speeding, driving under the influence, and not wearing seat belts during the pandemic. In 2021, U.S. traffic fatalities reached a 16-year high, with nearly 43,000 deaths. 

“When everyday life came to a halt in March 2020, risky behaviors skyrocketed and traffic fatalities spiked,” said National Highway Traffic Safety Administration (NHTSA) administrator Steven Cliff.  “We’d hoped these trends were limited to 2020, but, sadly, they aren’t.”

In 2022, NHTSA estimates, 9,560 people died in motor vehicle crashes between January and March, up 7 percent from the same period in 2021, making it the deadliest first quarter since 2002. 

The IRC report highlights the role of attorney involvement in driving up insurer expenses – and, ultimately, policyholder premiums – in states where auto coverage is least affordable. As attorney involvement tends to be more prevalent in bodily injury claims cases, the NHTSA numbers are important for understanding anticipated upward pressure on premium rates.

All these factors contribute to increased frequency and severity of claims and, ultimately, higher premiums as insurers seek to maintain required levels of surplus to ensure their ability to keep their promises to policyholders. 

Cellphone Bans Cut Crashes; TelematicsCan Help ReduceDistracted Driving

Max Dorfman, Research Writer, Triple-I

State prohibitions on cellphone use while driving correlate with reduced crash rates, according to recent research by the Insurance Institute for High Safety (IIHS). However, overall results were mixed among the states studied, with different legal language, degrees of enforcement, and penalty severity, providing possible explanations for the differing outcomes.

The study observed crash rate changes in California, Oregon, and Washington after legislation to prevent cellphone calls and texting while driving was enacted in 2017, with the research looking at overall numbers from 2015 to 2019. These numbers were compared to control states Idaho and Colorado.

Notably, the study found:

  • A 7.6 percent reduction in the rate of monthly rear-end crashes of all severities relative to the rates in the control states;
  • Law changes in Oregon and Washington were associated with significant reductions of 8.8 percent and 10.9 percent, respectively;
  • California did not experience changes in rear-end crash rates of all severities or with injuries associated with the strengthened law.

Still, state governments face several hurdles in their efforts to prevent crashes caused by cellphone use.

“Technology is moving much faster than the laws,” said Ian Reagan, a senior research scientist at IIHS. “Our findings suggest that other states could benefit from adopting broader laws against cellphone use while driving, but more research is needed to determine the combination of wording and penalties that is most effective.”

Distracted driving remains a major issue

Distracted driving remains a significant problem on roads nationwide. Indeed, distracted driving increased more than 30 percent from February 2020 to February 2022, due largely to changes in driving patterns spurred by the coronavirus pandemic, according to research by telematics service provider Cambridge Mobile Telematics.

The Governors Highway Safety Association (GHSA) reported that more than 3,100 people died in distraction-related accidents in 2020, with an estimated 400,000 people injured each year in such crashes. The true numbers, according to the study, are likely higher due to underreporting. The report also found that cell dial, cell text, and cell-browse were among the most prevalent and highest-risk behaviors.

Telematics can help

Telematics, which uses mobile technology to track driver behavior and provide financial incentives to drive less and often and more carefully, can help reduce dangerous driving. The more consumers positively react to the incentive, the less they pay for their insurance.

Research from the Insurance Research Council – like Triple-I, a nonprofit affiliate of The Institutes, focused on this exact issue, studying public perception and use of telematics. The study found that 45 percent of drivers surveyed said they made significant safety-related changes in the way they drove after participating in a telematics program. Another 35 percent said they made small changes in the way they drive.

During the pandemic, insurance consumers’ comfort with the idea of letting their driving be monitored in exchange for a better premium appeared to improve. In May 2019, mobility data and analytics firm Arity surveyed 875 licensed drivers over the age of 18 to find out how comfortable they would be having their premiums adjusted based on telematics variables. Between 30 and 40 percent said they would be either very or extremely comfortable sharing this data. In May 2020, they ran the survey again with more than 1,000 licensed drivers.

“This time,” Arity said, “about 50 percent of drivers were comfortable with having their insurance priced based on the number of miles they drive, where they drive, and what time of day they drive, as well as distracted driving and speeding.”

2022 P&C Underwriting Profitability Seen Worsening as Inflation, Hard Market Persist

The property & casualty insurance industry’s combined ratio – an indicator of underwriting profitability – is forecast at 100.7 for 2022, up 1.2 points from 2021, according to actuaries at Triple-I and Milliman, a risk-management, benefits, and technology firm. They presented their findings at a Triple-I members-only virtual webinar.

Combined ratio represents the difference between claims and expenses paid and premiums collected by insurers. A combined ratio below 100 represents an underwriting profit, and a ratio above 100 represents a loss. The industry in 2021 was barely profitable, with a combined ratio of 99.5.

Losses have been driven by significant deterioration in the personal auto line. Dale Porfilio, Triple-I’s chief insurance officer, said the 2022 net combined ratio for personal auto is forecast to be 105.2 – 3.8 points higher than 2021, driven primarily by significant deterioration in auto physical damage coverages.

Across most product lines, inflation, supply-chain disruptions, and geopolitical risk are expected to keep pushing insured losses and premium rates higher.

“We forecast 2022 P&C premium growth of 8.5 percent,” Porfilio said. “This is lower than the 9.2 percent growth in 2021, but still strong due to the hard market.”

Dr. Michel Léonard, Triple-I chief economist and data scientist, discussed key macroeconomic trends affecting the property/casualty industry results. He noted that insurance growth continues to be constrained by economic fundamentals, with replacement-cost increases well above pre-COVID levels and sub-par underlying growth.

Jason B. Kurtz, a principal and consulting actuary at Milliman, said another year of underwriting losses is likely for the commercial multi-peril line.

“More rate increases are needed to offset economic and social inflation loss pressures,” Kurtz said. “Social inflation” refers to the impact of litigation costs on insurers’ claim payouts, loss ratios, and, ultimately, how much policyholders pay for coverage.

Kurtz said the workers’ compensation line’s multi-year run of underwriting profits is expected to continue, although margins are likely to shrink further through 2024.

Dave Moore, president of Moore Actuarial Consulting, said the 2022 combined ratio for commercial auto is forecast to be 101.4 percent.

“We are forecasting underwriting losses for 2022 through 2024 due to prior-year development and the impact of inflation – both social inflation and economic inflation,” Moore said.

Pot Legalization Link To Car Crashes Variesby State, Study Finds

Max Dorfman, Research Writer, Triple-I

Recreational marijuana use is associated with automobile crash trends, according to a paper published in the Journal of Studies on Alcohol and Drugs. However, the study also noted that retail marijuana sales aren’t solely responsible for the general rise in accidents.

Legalization of recreational marijuana use was correlated to a 6.5 percent growth in the rate of crashes involving injuries and a 2.3 percent rise in those involving fatalities. With legalization and retail sales, the study found that the total impact was a 5.8 percent rise in injury crash rates and a 4.1 percent increase in fatal crash rates.

But these results were inconsistent across states, with the effects on injury crash rates varying from a 7 percent decrease to an 18 percent rise and fatal crash rates ranging from a 4 percent increase to a 10 percent decline. Colorado experienced the biggest rise in injury crash rates after legalization and retail sales, coming in at 17.8 percent. Nevada experienced the largest decline in fatal crashes, at 9.8 percent.

“Legalization removes the stigma of marijuana use, while the onset of retail sales merely increases access,” said lead researcher Charles M. Farmer of the Insurance Institute for Highway Safety. “But access to marijuana isn’t difficult, even in places without retail sales. Users who previously avoided driving high may feel that it’s okay after legalization.”

Farmer added, “Studies looking for a direct causal link between marijuana use and crash risk have been inconclusive.” Unlike with alcohol, no objective measure yet exists for how impaired a marijuana user has become.

As Triple-I notes, most studies find that marijuana use results in impaired coordination, memory, associative learning, attention, cognitive flexibility, and reaction time. Although it is clear from this research that driving ability is diminished, the extent of impairment continues to be studied.

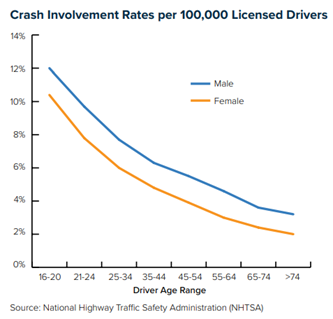
Younger drivers are at higher risk of traffic accidents than older drivers, with younger male drivers at high risk. Early evidence indicates that younger male drivers are most likely to drive under the influence of marijuana.

Another study, in the journal Drug and Alcohol Dependence, suggests chronic, heavy use of recreational marijuana impairs driving skills, even when the driver is not high, with those who started regularly using marijuana before 16 years old showing the worst results.

These results demonstrate that the effects of marijuana vary widely across demographic groups, making it all the more important for everyone to be cautious when using the drug.

Delaware Legislature Adjourns Without Action on Banning Genderas Auto Insurance Factor

Delaware’s state Legislature adjourned for the year without the House taking action on Senate Bill (SB) 231, which called for prohibiting the use of gender as a rating factor in personal automobile insurance policies.

The measure was based on research conducted with the Consumer Federation of America that contended many insured Delaware women are charged more than men, even when all other factors are the same. If signed into law, it would have required Delaware’s auto insurers to revisit how they price their personal automobile insurance policies for all drivers. Six states – California, Hawaii, Massachusetts, Michigan, North Carolina, and Pennsylvania – already have similar laws in place.

“The Delaware state Legislature and the Department of Insurance have the right and responsibility to govern and regulate how insurance companies conduct business within the State of Delaware,” Triple-I Chief Insurance Officer Dale Porfilio wrote in response to SB 231, which was approved by the Delaware Senate in April 2022. However, in his letter to Delaware Insurance Commissioner Trinidad Navarro, he raised several concerns with the underlying research, including:

Website Quotes vs. Issued Policies. While the Internet and electronic processing of quotes have dramatically improved the speed and accuracy of quotes, Porfilio wrote, “Many details can change for the portion of quotes which ultimately become issued policies, causing quotes to not be 100 percent accurate for issued premiums.”

Single Hypothetical Insured vs. Range of Actual Insureds. The report studied hypothetical 35-year-old drivers, then drew a conclusion about the full breadth of female and male drivers in the state of Delaware.

Aggregation across Zip Codes. Pricing methodologies are refined to very specific territorial definitions, which vary by insurer, and the report does not describe how the sample was aggregated across Zip Codes.

Porfilio explained that a consequence of enacting S.B. 231 would be a redistribution of who pays how much premium, with most of the premium increases paid by female policyholders (notably at younger ages), and a majority of the premium decreases received by male policyholders.

Critics of U.S. auto insurer pricing practices have expressed concerns that certain rating factors discriminate against certain groups. Triple-I has explained in multiple contexts how U.S. auto insurers use a wide variety of rating factors to accurately price policies.  These factors must conform to the laws and regulations of the state in which the auto insurance policies are sold,  and eliminating any one could force less-risky policyholders to overpay and allow those with greater risk to pay less than they should.

Learn more about auto insurance pricing

Triple-I: Rating-Factor Variety Drives Accuracy of Auto Insurance Pricing

Why Personal Auto Insurance Rates Are Likely to Keep Rising

IRC Releases State-by-State Auto Insurance Affordability Rankings