

Triple-I’s latest Issues Brief, Lloyd’s: Trends and Insights, spotlights one of the world’s leading specialist insurance and reinsurance marketplaces. The brief explains how the nearly 350-year-old platform has functioned differently from the common stand-alone model while evolving into an integral source of capacity and resilience for the global 21st-century risk landscape.
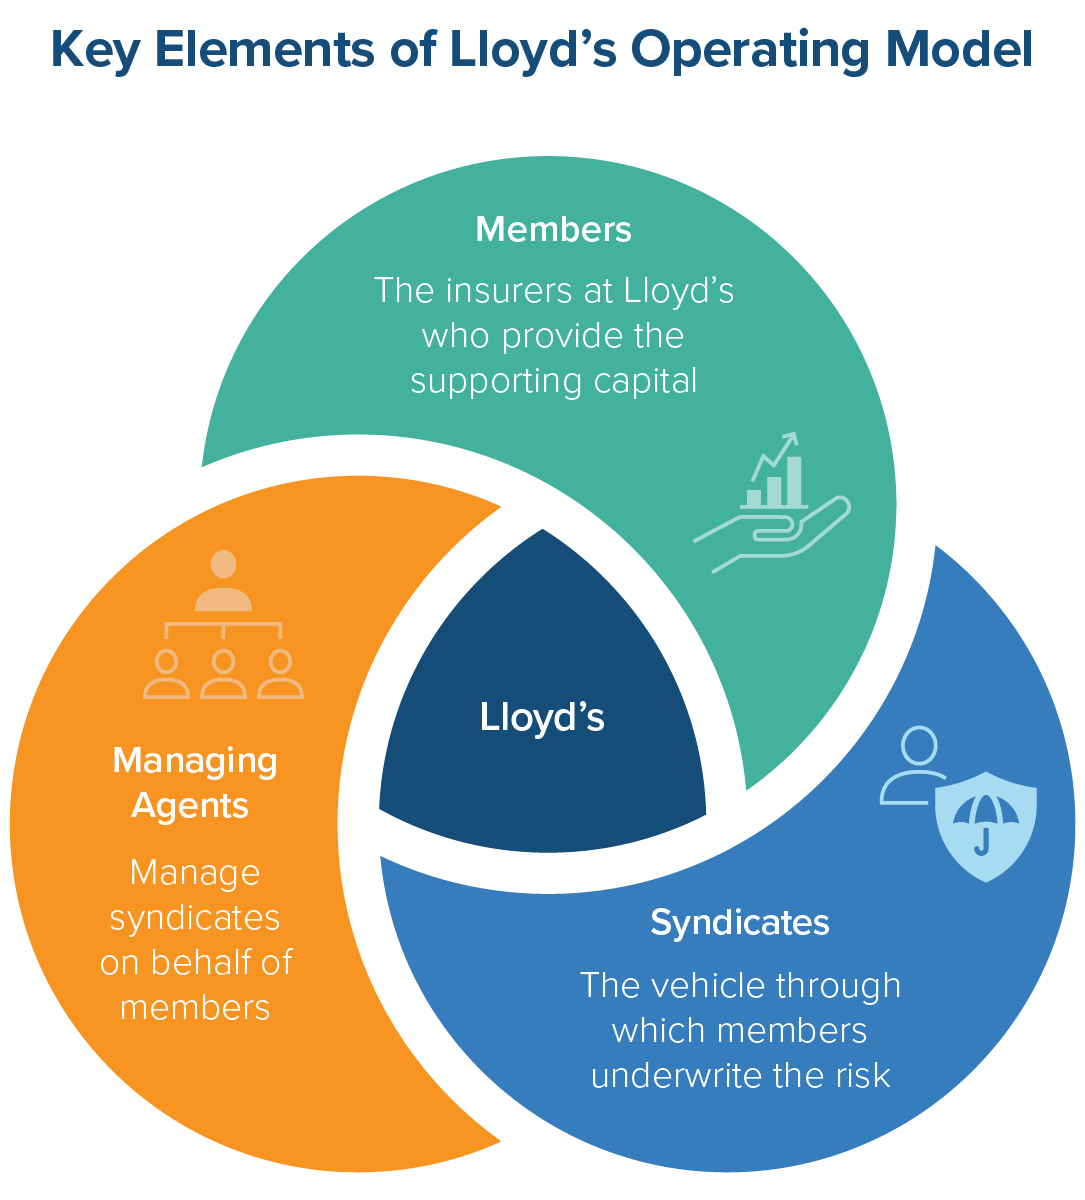
Contrary to a common misperception, Lloyd’s is not a single insurer; rather it’s a marketplace – i.e. hub, network, platform – connecting risk brokers, underwriters, and capital providers who negotiate the transfer of risk. It consists of three core groups:
- Members: Persons or corporate entities that provide the capital that funds a syndicate.
- Syndicates: An accounting construct with assets, liabilities, and Profit and Loss (P&L) statement segregated from those of other Lloyd’s syndicates.
- Managing Agents: Entities appointed by syndicate members to handle underwriting and claims, as well as oversee the governance and operations on behalf of the syndicates.
The arrangement allows policies to have multiple underwriters, enabling each underwriter to take on more risk than they would have the appetite for as a sole underwriter. As a result, complex and hard-to-place risks can be covered.
Another distinctive feature of Lloyd’s is its capital structure, also known as the “Chain of Security.” The brief explains how the Chain of Security is designed to provide the financial backing for all insurance policies written at Lloyd’s. As a result of this setup, the major rating agencies typically apply a single financial strength rating (FSR) to all the policies written through Lloyd’s, regardless of which syndicates participate in the policy.
Successful handling of long-tail and complex risks – where claims may emerge decades later – can be vital to fostering confidence in the larger insurance industry. Throughout its long history, Lloyd’s has been called upon to absorb extreme and unexpected losses while paying claims and recapitalizing. This track record includes playing a key role in supporting U.S. economic recovery, from major disasters, such as the 1906 San Francisco earthquake, the September 11 attacks, Hurricane Katrina, and more recent hurricanes and wildfires.
Managing uncertainty in today’s fast-evolving risk landscape can require keeping abreast of interconnected threats that outpace traditional risk management strategies. Insurers and risk managers can improve the prediction and prevention of emerging threats across core strategic areas:
- advancing analytics capabilities
- strengthening capital resilience
- collaborating across the industry
Centering these objectives, Lloyd’s cultivates channels for talent development, innovation, and new capital flows.
For example, its London Bridge 2 (LB2) platform gives institutional investors a flexible and efficient means to deploy funds into the Lloyd’s market, attracting approximately $2.5 billion in new capital since its launch in 2022. Lloyd’s education platform supports the sustainable growth of the market by equipping professionals with the insight needed to navigate the emerging risk landscape. And, Lloyd’s Lab – a product development accelerator designed to rapidly develop, test, and refine new products, concepts, and solutions – supported 48 U.S. startups, which collectively have raised $490 million to scale solutions tackling wildfire, flood, and cyber risks.
The United States is Lloyd’s largest market, accounting for roughly half of the marketplace’s global premiums. Excess and surplus underwriting accounts for over 60 percent of Lloyd’s total premiums written in the U.S. In 2024, this share worked out to $20.8 billion in surplus lines insurance capacity, approximately 16 percent of the entire U.S. surplus lines market. Additionally, Lloyd’s gross written premiums for U.S. reinsurance totaled $9.86 billion in 2024, with the marketplace ceding around $2.9 billion annually in reinsurance premiums to U.S. reinsurers.
This special edition of the Triple-I issue brief series is part of ongoing efforts to educate and raise awareness about how insurance market participants support coverage affordability and availability.


