By Loretta Worters, Vice President, Media Relations, Triple-I
Maritime Day is a time-honored tradition that recognizes one of the United States’ most important industries. It is observed on May 22, the date in 1819 that the American steamship Savannah set sail from Savannah, Ga., on the first ever transoceanic voyage under steam power.
“National Maritime Day was created by an Act of Congress in 1933 to celebrate our nation’s mariners – the Merchant Marine,” John A. Miklus, president of the American Institute of Marine Underwriters (AIMU), the trade association representing the U.S. ocean marine insurance industry. “Today, it has expanded to include the entire maritime industry and domestic water-borne commerce, of which marine insurance is a very important part.”
Marine insurance covers the loss or damage of ships, cargo, terminals, and any transport by which the property is transferred, acquired, or held between the points of origin and the destination. Cargo insurance is the sub-branch of marine insurance, though marine insurance also includes onshore and offshore exposed property, (container terminals, ports, oil platforms, pipelines), hull, marine casualty, and marine liability.
“The U.S. ocean marine insurance industry covers every imaginable kind of vessel and cargo, whether it’s a small pleasure craft or yacht, on up to the largest cruise ship or container ship calling on a major port here in the United States,” said Miklus, a former marine insurance underwriter with extensive marine insurance and reinsurance experience.
“Marine insurance and marine commerce are often thought of as an invisible industry,” he said. “People see an Amazon truck arrive but have no idea how that package found its way to their front doorstep.”
Insurance is designed to manage risks in the event of unfortunate incidents like cargo losses, damage to expensive ships, environmental disasters due to oil pollution, piracy and recently supply chain issues.
Miklus is passionate about the marine insurance business and is proud of the work of AIMU and the industry it serves.
“Today, in modern commerce, 90 percent of the goods found in our homes probably arrived on a container ship,” Miklus said. “As vital parts of commerce, these goods all need to be insured, and our member companies of AIMU insure those goods.”
By Loretta Worters, Vice President, Media Relations, Triple-I
When Isabelle Therrien started in the marine insurance industry 25 years ago, it was almost exclusively a male-dominated industry.
“The progress we’ve made is a testament to the women that have been part of this industry and that have empowered other women to get into this business and created opportunities for them,” said Therrien — now senior vice president – Canada at Falvey Cargo Underwriting. Therrien has held various senior marine underwriting positions in Montreal, Toronto, and New York. In addition to Falvey, she spent more than 10 years with Chubb.
“There are jobs in the maritime industry, whether it’s the maritime industry at large or marine insurance,” said Therrien, who is also chair of the International Union of Marine Insurance (IUMI) cargo committee. “We look for people that have studied business or logistics, or who have been at sea and now want to have a job outside of being at sea, people who have an interest in global trade.”
With nearly half of the current workforce being eligible for retirement in the next 10 years, there’s never been a better time for women to enter the maritime industry and change the demographic.
“I did not know when I started that I would last this long in marine insurance,” said Therrien, “but if you tried to take it away from me right now, I’d say absolutely not. I love it and I really think it’s a great opportunity for people to learn more about globalization, insurance and how we support global trade.”
Honoring Women in Maritime
In December 2021, the International Maritime Organization (IMO) Assembly adopted a resolution proclaiming the first-ever International Day for Women in Maritime, to be observed annually on May 18.
The observance will celebrate women in the industry and is intended to promote the recruitment, retention, and sustained employment of women in the maritime sector; raise the profile of women in maritime; strengthen IMO’s commitment to the UN sustainable development of gender equality; and support work to address the current gender imbalance in maritime.
History of Women in Maritime Industry
Women in the maritime industry have a rich history that’s rarely given the recognition it deserves, according to the Maritime Institute of Technology (MITAGS). Women have been making a name for themselves on the water for hundreds of years – such as when emergencies called them to wartime duty, to support their families, to find a better life, or even just to find adventure and new surroundings.
Turning the tide
While women still only comprise two percent of the 1.2 million seafarers worldwide, it’s no longer virtually impossible for them to enter the industry. The most significant barriers that hinder women from entering non-traditional industries and apprenticeships include:
Lack of awareness: Perhaps the biggest reason there aren’t more women in the maritime sector is simply a lack of knowledge that it’s an available career path. If women don’t have family members already in the industry or know of someone who works at sea, it could easily be an option that passes under the radar. Many people also don’t even consider the maritime industry because it doesn’t result from the traditional four-year college route.
Traditional gender roles: The lasting stigma that the maritime industry is for men only likely continues to deter women from joining the field.
Gender inequities in maritime and marine insurance mirror those of the overall insurance industry. While over 60 percent of the insurance workforce (1.6 million) are women, leadership is where inequity exists, according to an ACORD 2018 study. Women occupy only 19 percent of board seats, 11 percent of named inside officer positions, and 12 percent of top officer positions. Only 8 percent of insurers have formal programs to develop strong careers for women. Further, women in insurance still earn less than men – 62cents on the dollar. This is even worse than the pay gap in 1951.
There has also been a large discrepancy in promotions. In the maritime industry, most women leave or change jobs because they are kept at a level for so long, which is not the case with their male counterparts having the same qualifications and experience.
About 90 percent of the world’s products are carried by sea. It is one of the largest international industries, with a vast need for technical, legal, and administrative talent. With the maritime industry growing and the number of capable candidates not keeping up, marine companies are turning to underrepresented worker categories, especially women.
There are career opportunities covering the design and building of ships, maritime environment/resources management and protection, training, marine insurance, maritime law, ports and harbor management, and administration and managing of internal water resources.
“We are very honored to be a part of this important partnership,” said John Miklus, president of the AIMU, a not-for-profit trade association representing and promoting the interests of the U.S. ocean marine insurance industry and serving as an educator and resource center for the marine insurance community. “These women are role models for our industry and are extremely accomplished.”
The event is part of Falvey’s larger speaker series to highlight professional women — “Women at the Helm” – and will include a panel discussion with Captain Alexandra Hagerty, Ship Captain, Executive Leader, Master on Hospital Ship Africa Mercy; Meredith Neizer, Chief Logistics Officer at ARMADA; Tiina Ruhlandt, President & CEO at EIMC; and Karen L. Griswold, SVP Ocean Marine, Property & Specialty at Chubb.
Data visualization has become an increasingly important tool for understanding and communicating complex risks and informing plans to address them.
Simply put, data visualization is the depiction of data through static or interactive charts, maps, infographics, and animations. Such displays help clarify multifaceted data relationships and convey data-driven insights.
The origins of data visualization could be considered to go back to the 16th century, during the evolution of cartography. However, modern data visualization is considered to have emerged in the 1960s, when researcher John W. Tukey published his paper The Future of Data Analysis, which advocated for the acknowledgement of data analysis as a branch of statistics separate from mathematical statistics. Tukey helped invent graphic displays, including stem-leaf plots, boxplots, hanging rootograms, and two-way table displays, several of have become part of the statistical vocabulary and software implementation.
Since Tukey’s advancements, data visualization has progressed in extraordinary ways. Matrices, histograms, and scatter plots (both 2D and 3D) can illustrate complex relationships among different pieces of data. And, in an age of big data, machine learning, and artificial intelligence, the possible applications of data science and data analytics has only expanded, helping curate information into easier to understand formats, giving insight into trends and outliers. Indeed, a good visualization possesses a narrative, eliminating the extraneous aspects of the data and emphasizing the valuable information.
Whether for tracking long-term rainfall trends, monitoring active wildfires, or getting out in front of cyber threats, data visualization has proved itself tremendously beneficial for understanding and managing risk.
The Triple-I uses data visualization in its Resilience Accelerator to better illustrate the risks many communities face with natural disasters, particularly hurricanes, floods, and resilience ratings. Spearheaded by Dr. Michel Leonard, Chief Economist and Data Scientist, Head of the Economics and Analytics Department at the Triple-I, these data visualizations provide an ever-needed way to more effectively communicate these hazards, expanding the knowledge base of insurers, consumers, and policymakers.
To further understand data visualization, we sat down with Dr. Leonard.
Why is data visualization so essential in preparing for and responding to catastrophes? What immediately comes to mind is maps. We can make spreadsheets of policies and claims, but how do you express the relationships between each row in these spreadsheets? We can use data visualization to show how houses closest to a river are most at risk during a flood or show the likely paths of wildfires through a landscape. Before a catastrophe, these tools help us identify at-risk zones to bolster resilience. After a catastrophe, they help us identify areas that need the most to rebuild.
How can data visualization help change the way insurers confront the challenges of catastrophes? The most crucial aspect of data visualization for insurers is the potential to explore “what-if” scenarios with interactive tools. Understanding risk means understanding what range of outcomes are possible and what it most likely to happen. Once we start accounting for joint outcomes and conditional probabilities, spreadsheets turn into mazes. Thus, it’s important to illustrate the relationship between inputs and outputs in a way that is reasonably easy to understand.
With the increasing threat of climate risk, how much more significant do you anticipate data visualization will become? I’m reminded of the writings from the philosopher Timothy Morton, who described climate change as a “hyper-object”: a multifaceted network of interacting forces so complex, and with so many manifestations that it is almost impossible to fully conceptualize it in your head at once.
Climate change is complicated and communicating about the risks it creates is a unique problem. Very few people have time to read through a long technical report on climate risk and how it might affect them. Thus, the question becomes: How do we communicate to people the information they need in a way that is not only easy to understand but also engaging?
Images or infographics have always been compelling tools; however, we prefer interactive data visualization tools for their ability to capture attention and curiosity and make an impression.
How does the Resilience Accelerator fit into the sphere of data visualization? With the Resilience Accelerator, we wanted to explore the interplay between insurance, economics and climate risk, and present our findings in an engaging, insightful way. It was our goal from the beginning to produce a tool that would help policymakers, insurers, and community members could find their counties, see their ratings, compare their ratings with those of neighboring counties, and see what steps they should take to improve their ratings.
What motivated this venture into data visualization – and how can it help change the ways communities, policymakers, and insurers prepare for natural disasters?It’s our job to help our members understand climate-related risks to their business and to their policyholders. Hurricanes and floods are only the first entry in a climate risk series we are working on. We want our data to drive discussion about climate and resilience. We hope the fruits of those discussions are communities that are better protected from the dangers of climate change.
Where do you see data visualization going in the next five to 10 years? I’m interested in seeing what comes from the recent addition of GPU acceleration to web browsers and the shift of internet infrastructure to fiber optics. GPU acceleration is the practice of using a graphics processing unit (GPU) in addition to a central processing unit (CPU) to speed up processing-intensive operations. Both of these technologies are necessary for creating a 3-D visualization environment with streaming real-time data.
The latest insurance underwriting projections for property/casualty lines by actuaries at the Triple-I and Milliman – an independent risk-management, benefits, and technology firm – reveal that the industry saw the 2021 combined ratio worsen by 0.8 points from 2020, driven by deterioration in the personal auto and workers compensation lines. The report, Insurance Information Institute (Triple-I) /Milliman Insurance Economics and Underwriting Projections: A Forward View, presented at a members-only event on May 12, also found that homeowners, commercial auto, commercial multi-peril, and general liability all experienced significant improvement year-over-year.
Michel Léonard, PhD, CBE, Chief Economist and Data Scientist, and head of Triple-I’s Economics and Analytics Department, discussed key macroeconomic trends impacting the property/casualty industry results. He noted that the U.S. P&C insurance industry’s performance continues to be constrained by historically high inflation, which affects replacement costs.
“The insurance industry’s performance continues to be severely constrained by macroeconomic fundamentals,” he said “The average replacement costs for P&C lines is 16.3 percent, nearly twice the U.S. average CPI of 8.5 percent.”
Léonard noted that while the Federal Reserve forecasts U.S. inflation slowing to 4.3 percent by yearend, “Triple-I expects the transition to take longer.”
Dale Porfilio, FCAS, MAAA, Chief Insurance Officer at Triple-I, noted that 2021 had the worst full-year catastrophe losses since 2017, though Q4 actuals were materially lower than prior expectation. Kentucky tornadoes and Colorado wildfires in December were part of these losses, with homeowners suffering over 60 percent of the insured losses. Hurricane Ida was the worst single event, although multiple other billion-dollar events also contributed to the 2021 insured catastrophe losses.
“Healthy premium growth observed in 2021 is likely to continue through 2024 due to the hard market,” Porfilio said, adding, “Net expense ratio at 27.0 points was the lowest in more than a decade due to premiums growing at a faster rate than expenses.”
For the P&C industry as a whole, he said to expect loss pressures to continue due to inflation and supply chain disruption.
On the commercial side, Jason B. Kurtz, FCAS, MAAA, a principal and consulting actuary at Milliman, said the commercial multi-peril 2021 combined ratio improved 3.6 points from 2020, primarily due to strong net earned premium growth, which stood at 6.3 percent year over year, from the economic recovery and a hard market.
“Despite the improvement relative to 2020, the CMP line still experienced an underwriting loss in 2021, and we expect underwriting results in 2022-2024 will continue to be adversely impacted by inflation and CAT loss pressures,” he said.
Workers compensation had another very profitable year, Kurtz said, with the 2021 combined ratio coming in at 91.8 percent, although margins shrank in 2021 and are expected to continue to shrink through 2024.
“The workers comp line has experienced seven straight years of underwriting profitability, a remarkable turn-around after eight straight years of underwriting losses,” Kurtz said. “Not surprisingly, rate increases have been hard to come by. Coupled with low unemployment, these forces will constrain premium growth for the foreseeable future.”
For commercial auto, the 2021 combined ratio improved by 3.0 points from 2020 due to lower adverse development and a two point reduction in expense ratio, according to Dave Moore, FCAS, MAAA of Moore Actuarial Consulting.
“The 2021 combined ratio dipped below 100 percent for the first time since 2010 and we’ve had the lowest expense ratio in more than a decade,” he said. “Watch for social inflation loss pressure and prior year adverse loss development in 2022-2024.”
According to projections, both personal auto and homeowners lines produced underwriting losses in 2021. Prices need to reflect the underlying risk, particularly because the economic risk is quickly escalating.
Porfilio said the 2021 combined ratio for personal auto jumped up to 101.4, the worst since 2017 and 8.9 points worse than 2020.
“While miles driven are largely back to 2019 levels, riskier driving behaviors have led to increased insured losses and fatality rates,” he said.
Overall, the loss pressures from inflation, supply-chain disruption, risky driving behavior, and increasing catastrophe losses are leading to the need for rate increases to restore both homeowners and personal auto lines to an underwriting profit, which is projected to take at least two more calendar years.
By Max Dorfman, Research Writer, Triple-I (04/29/2022)
Several recent reports quantify the growing risk and cost of cyber attacks in 2021.
Willis Towers Watson PLC, a multinational risk-management, insurance brokerage, and advisory company, and global law firm Clyde & Co, surveyed directors and risk managers based in more than 40 countries around the world. They found that 65 percent regard cybercrime as “the most significant risk” facing directors and officers. Data loss and cyber extortion followed, at 63 percent and 59 percent, respectively.
In 2021, there were 623.3 million cyberattacks globally, with U.S. cyberattacks rising by 98 percent, according to cybersecurity firm SonicWall. Almost every threat increased in 2021, particularly ransomware, encrypted threats, Internet of Things (IoT) malware, and cryptojacking, in which a criminal uses a victim’s computing power to generate cryptocurrency.
The frequency of ransomware attacks alone rose by 105 percent globally in 2021, SonicWall says, making them the most frequent type of cyberattack on record. The State of Ransomware 2022 by Sophos, a security software and hardware company, found that 66 percent of organizations surveyed were attacked by ransomware in 2021, rising from 37 percent in 2020. Ransomware payments often trended higher, with 11 percent of organizations stating that they paid ransoms of $1 million or more, up from 4 percent in 2020. Additionally, 46 percent of organizations that had data encrypted in a ransomware attack paid the ransom.
The 2021 Software Supply Chain Security Report by Argon, an Aqua Security company, underscores the main areas of criminal focus, including: “open-source vulnerabilities and poisoning; code integrity issues; and exploiting the software supply chain process and supplier trust to distribute malware or backdoors.”
According to the Argon report, cybercriminals often use these methods to extort victims:
Encryption: Victims pay to regain access to scrambled data and compromised computer systems that stop working because key files are encrypted.
Data Theft: Hackers release sensitive information if a ransom is not paid.
Denial of Service (DoS): Ransomware gangs launch denial of service attacks that shut down a victim’s public websites.
Harassment: Cybercriminals contact customers, business partners, employees, and media to tell them the organization was hacked.
“The number of attacks over the past year and the widespread impact of a single attack highlights the massive challenge that application security teams are facing,” said Eran Orzel, a senior director at Argon.
Cyber insurers work toward protecting businesses
Cyber insurance remains an important investment for many companies, particularly as cyberattacks continue to wreak havoc across industries. Investing in cyber insurance can help an organization recover from an attack, with cyber insurance companies often helping to recover data, repair damaged devices, protect a company from civil lawsuits, and fixing any reputational damage sustained during an attack.
However, the first line of defense is creating a robust cybersecurity system, training employees on how to identify a potential attack, encrypting company data, and enabling antivirus protection. With only half of businesses reporting a consistent encryption strategy, and the cost of data breaches continuing to rise, organizations must do more to protect themselves and their customers.
By Max Dorfman, Research Writer, Triple-I (04/27/2022)
A recent study by IBM and the Ponemon Institute quantifies the rising cost of data breaches as workers moved to remote environments during the coronavirus pandemic.
According to the report, an average data breach in 2021 cost $4.24 million – up from $3.86 million in 2020. However, where remote work was a factor in causing the breach, the cost increased by $1.07 million. At organizations with 81-100 percent of employees working remotely, the total average cost was $5.54 million.
To combat the risks associated the rise of remote work, the study highlights the importance of security artificial intelligence (AI) and automation fully deployed – a process by which security technologies are enabled to supplement or substitute human intervention in the identification and containment of incidents and intrusion efforts.
Indeed, organizations with fully deployed security AI/automation saw the average cost of a data breach decrease to $2.90 million. The duration of the breach was also substantially lower, taking an average of 184 days to identify the breach and 63 days to contain the breach, as opposed to an average of 239 days to identify the breach and 85 days to contain the breach for organizations without these technologies.
Organizations continue to struggle with breaches
In 2021 and 2022, several high-profile data breaches have illustrated the major risks cyberattacks represent. This includes a January 2022 attack 483 users’ wallets on Crypto.com, which resulted in the loss of $18 million in Bitcoin and $15 million in Ethereum and other cryptocurrencies.
In February, the International Committee of the Red Cross (ICRC) was targeted by a cyberattack that resulted in the hackers accessing personal information of more than 515,000 people being helped by a humanitarian program, with the intruders maintaining access to ICRC’s servers for 70 days after the initial breach.
And in April, an SEC filing revealed that the company Block, which owns Cash App, had been breached by a former employee in December of 2021. This leak included customers’ names, brokerage account numbers, portfolio value, and stock trading activity for over 8 million U.S. users.
Insurers play a key role in helping organizations
The increasing frequency and seriousness of cyberattacks has led more organizations to purchase cyber insurance, with 47 percent of insurance clients using this coverage in 2020, up from 26 percent in 2016, according to the U.S. Government Accountability Office. This shift includes insurers offering more policies specific to cyber risk, instead of including this risk in packages with other coverage.
The insurance industry offers first-party coverage – which typically provides financial assistance to help an insured business with recovery costs, as well as cybersecurity liability, which safeguards a business if a third party files a lawsuit against the policyholder for damages as a result of a cyber incident.
A third option, technology errors and omissions coverage, can safeguard small businesses that offer technology services when cybersecurity insurance doesn’t offer coverage. This kind of coverage is triggered if a business’s product or service results in a cyber incident that involves a third party directly.
Still, the primary focus for organizations looking to defend themselves from cyberattacks is implementing a rigorous cyber defense system.
A U.S. District Court judge in Delaware made his courtroom the latest jurisdiction to require lawsuit participants to disclose whether third-party investors have any stake in litigation being brought before him.
While this is a step toward greater transparency with regard to third-party litigation funding, the standing order by Chief Judge Colm F. Connolly only affects cases in his court. The other three district court judges in Delaware have not issued similar decrees. But the order was made in an extremely influential district. More than half of publicly traded U.S. corporations are incorporated in Delaware, and the state’s laws often govern contracts between businesses.
A booming global industry
Funding of lawsuits by international hedge funds and other financial third parties – with no stake in the outcome other than a share of the settlement – has become a $17 billion global industry, according to Swiss Re. Law firm Brown Rudnick sees the industry as even larger, at $39 billion globally, according to Bloomberg.
Third-party litigation funding was once widely prohibited. As bans have been eroded in recent decades, it has grown, spread, and become a contributor to “social inflation”: increased insurance payouts and loss ratios beyond what can be explained by economic inflation alone.
Efforts at transparency
Some progress in toward greater transparency has been made in recent years. Last year, the U.S. District Court for the District of New Jersey amended its rules to require disclosures about third-party litigation funding in cases before the court. The Northern District of California imposed a similar rule in 2017 for class, mass, and collective actions throughout the district. Wisconsin passed a law requiring disclosure of third-party funding agreements in 2018. West Virginia followed suit in 2019.
At the federal level, the Litigation Funding Transparency Act was introduced and referred to the Senate Judiciary Committee in October 2021.
Panelists at Triple-I’s Joint Industry Forum in December 2021 agreed on the importance of requiring disclosure of litigation funding. Insurance groups and the U.S. Chamber of Commerce say litigation funding needs more rules to prevent abuses of the legal system and to protect consumers, who often pay exorbitant interest rates on money they borrow to pay legal expenses.
“By its very nature, third-party litigation financing promotes speculative litigation and increases costs for everyone,” said Stef Zielezienski, executive vice president and chief legal officer for the American Property Casualty Insurance Association in a press release about the Delaware order. “At its worst, outside investment in litigation financing dependent on a successful verdict creates incentives to prolong litigation.”
The Delaware judge’s order requires, in addition to disclosing the name and address of any third-party funder, that parties to any case before his bench must also disclose whether approval by the funder is necessary for settlement decisions and, if so, the terms and conditions relating to that approval.
While strides like this may be small, they add up in the fight to make disclosure of third-party litigation financing a priority in states and in courthouses nationwide.
Insurers, regulators, and members of Congress have expressed concern about proposed changes in how Standard & Poor’s Global Ratings defines “available capital” in its rating criteria. Specifically, S&P would no longer consider certain debt to be counted as available for purposes of rating insurers’ financial strength and ability to pay claims.
“Disruptive” and an “overuse of market power” is how the Association of Bermuda Insurers and Reinsurers (ABIR) described the measure in an 18-page letter to S&P, which has requested comments by April 29 on its proposed methodology and assumptions for analyzing the risk-based capital adequacy of insurers and reinsurers.
S&P’s proposed changes, in ABIR’s view, would lead to the sudden removal of billions of dollars overnight that otherwise would be available to underwrite catastrophe risk – a sector in which average insured losses have risen nearly 700 percent since the 1980s.
“This debt is viewed as capital by the regulators,” ABIR CEO John Huff says in a news release. “If carriers are forced to restructure debt, they’ll get less favorable terms today. Any replacement debt will increase financial leverage, which is counter to the stability people seek from a rating agency.”
ABIR points out ambiguity in the timing of the rollout of the planned changes, saying, “Insurers and reinsurers will have no time to respond to the new debt treatment before S&P has indicated the changes will go into effect.”
“There is no glide path or grandfathering,” Huff says. “It’s just a cliff. “
Bermuda’s insurers urge the rating agency to provide a transition period for any such changes, as well as grandfathering debt that already is in place.
“If there’s a transition plan, we can work within that,” Huff says. “But having this so abrupt is quite disruptive. Standard & Poor’s should be adding stability, not causing disruption.”
By Loretta Worters, Vice President, Media Relations, Triple-I
As pet owners return to the workplace or school, pets will be left home alone. Behavioral issues such as separation anxiety could result in aggressive and destructive behavior. This could be a problem for dogs that were adopted during the pandemic as well as pets that have become used to their pet owners being at home.
March 2020 had the most dog-related injury claims, when people first went into lockdown at the start of the COVID-19 pandemic, according to State Farm. Dog bites were up 21.6 percent from the previous March, likely due to dogs dealing with owner stress, disruption in routines and more people around the house throughout the day. With the easing of restrictions for activities outside the home—experts feared it would lead to another spike in bites. The overall number of claims slightly increased to 17,989 in 2021 from 17,567 in 2020, accounting for more than one-third of all homeowners liability claims paid out, costing $881 million.
Dog bite-related claims costs have been climbing for years. The average cost per claim nationally has risen 39 percent from 2012 to 2021, due to increased medical costs and the upward trend in the size of settlements, judgments, and jury awards.
Claims costs are attributable not only to dog bites but also to dogs knocking down children, cyclists, and the elderly, which can result in costly injuries.
The latest Triple-I dog bite claim figures are released in conjunction with National Dog Bite Prevention Week, an event held each year to help reduce the number of dog bites.
Children are particularly at risk for dog bites and are more likely to be severely injured, so it’s essential for parents to teach their kids to be safe around strange dogs and their own pets.
Dog training is, of course, key to preventing dog bites and related injuries for everyone, and National Dog Bite Prevention Week’s organizers offer many practical tips. This year, dog experts are again focused on re-socializing animals that have been isolated along with their humans.
Triple-I recommends that you check your homeowners or renters insurance policy to be sure it covers liability for dog bites and related injuries. Click here for more details about dog bite liability insurance.
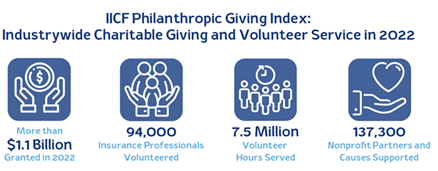
The Insurance Industry Charitable Foundation (IICF), a nonprofit dedicated to helping communities and enriching lives, has opened a humanitarian relief fund to help refugees in response to the crisis in Ukraine.
“The insurance industry has a longstanding legacy of philanthropic giving, locally and globally, in times of acute need. Throughout the pandemic – and now, as we raise funds in support of Ukrainian refugees – our industry strives to respond quickly and with impact,” said Hank Watkins, regional director and president of Lloyd’s, Americas and chair of the IICF International Board of Governors. “As an industry founded with the purpose of facilitating progress and responding during times of need, we appreciate the opportunity IICF provides for collaborating on philanthropic and volunteering initiatives, enabling us to continue sharing the very best of our industry with the world.”
Betsy Myatt, vice president and chief program officer, executive director of the IICF’s Northeast Division, noted that the organization “stands with the world and our industry in calling for peace in Ukraine.
With humanitarian efforts underway to address the needs of millions of refugees fleeing the violence – mostly women, children, and the elderly – IICF will join with our industry and many other companies and individuals throughout the world in this support through the IICF: Ukrainian Humanitarian Relief Fund.”
“Proceeds will benefit BeHumanKindness, CARE (Ukrainian Crisis Fund), Red Cross and Save the Children (Children’s Emergency Fund),” she said. “These nonprofit organizations are delivering immediate assistance in the region to the women, children, and families made refugees by the war. “
Insurers and foundations have already contributed millions of dollars toward Ukraine emergency response. The private sector is demonstrating its generosity and solidarity through direct contributions, while also launching creative initiatives to help engage stakeholders, such as employee match funding.
The Allstate Foundation, for example, created a $1 million dedicated Ukrainian Relief Fund that will support the American Red Cross, Razom, UNICEF and World Central Kitchen. Employee donations to the fund will receive a 100 percent match. “Allstate stands with the people of Ukraine and against Russia’s morally reprehensible attacks,” their statement read. “We set up a $1 million Ukrainian Relief fund and are matching employee donations as we support freedom, civility, and compassion for victims of this war.”
Allianz SE announced that it would make available 10 million euros to support humanitarian efforts along with up to 2.5 million euros to match employee donations. RLI Insurance Co. is matching its employees’ donations to the IICF: Ukrainian Humanitarian Relief Fund.
AXA has taken several initiatives to support the humanitarian crisis triggered by the war, with a donation of 6 million euros to NGOs working in Ukraine and the neighboring countries to support civil populations and refugees. AXA’s global philanthropic employee volunteering initiative, AXA Hearts in Action, initiated multiple local projects that will be supported by a group donation.
Munich Re said it is contributing to alleviate the hardship of the hundreds of thousands of war refugees. “As people are now primarily fleeing the battle zone via the Polish border, Munich Re is currently concentrating its aid on this region.”
Zurich Insurance Group CEO Mario Greco said, “Zurich is strongly committed to helping alleviate suffering in Ukraine. To that end, the Z Zurich Foundation announced a major fundraising effort to mobilize support across our businesses globally for humanitarian relief efforts. The safety and well-being of people across the region are a key concern in these sad times.”