Georgia Targets
Legal System Abuse

By Lewis Nibbelin, Contributing Writer, Triple-I

The Georgia Senate recently approved legislation aimed at curbing the state’s soaring litigation. Backed by Georgia Gov. Brian Kemp, Senate Bill 68 is designed to facilitate more equitable courtroom outcomes and stabilize insurance rates.

Among other provisions, the bill includes a cap on pain and suffering evidence that would reduce premises liability lawsuits, or those against owners for injuries and/or criminal conduct that occurred on their property. It also would restrict “phantom damages,” meaning plaintiffs could seek damages only in the amount actually paid for medical bills, rather than an inflated amount determined by a healthcare provider’s list prices.

Both practices have generated nuclear verdicts (awards of $10 million or more) in Georgia, contributing to the fourth-most nuclear verdicts in personal injury litigation per capita of any state from 2013 to 2022.

Another bill – SB 69 – targets third-party litigation funding, in which investors anonymously finance litigation and often delay prompt settlement in exchange for a share of larger damage awards, thereby driving up claims costs. If enacted, the bill would limit their influence over legal decisions and require third parties to register with the Department of Banking and Finance, effectively banning foreign adversaries from funding litigation.

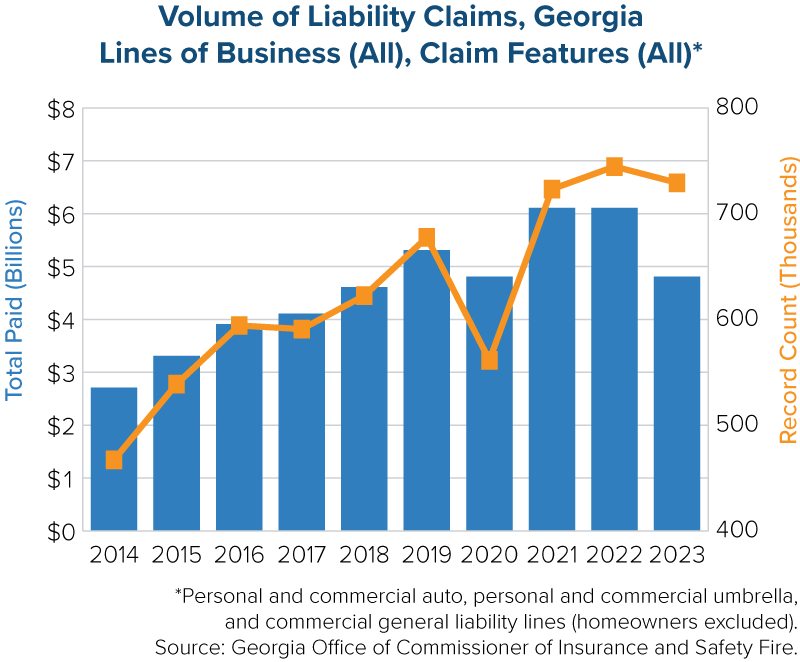
Much of the legislation is based on a report from the office of Georgia Insurance and Safety Fire Commissioner John F. King, which revealed a steady increase in liability claims frequency and identified growing legal involvement in claims as a key driver of insurance rates.

“Georgia’s legal climate amounts to a hidden tax on families and small businesses, driving up costs and threatening our long-term future,” King said in a recent press conference, explaining that tort reform can “level the playing field in our courtrooms and help ensure Georgia’s long-term prosperity and security.”

Economic impact on Georgia

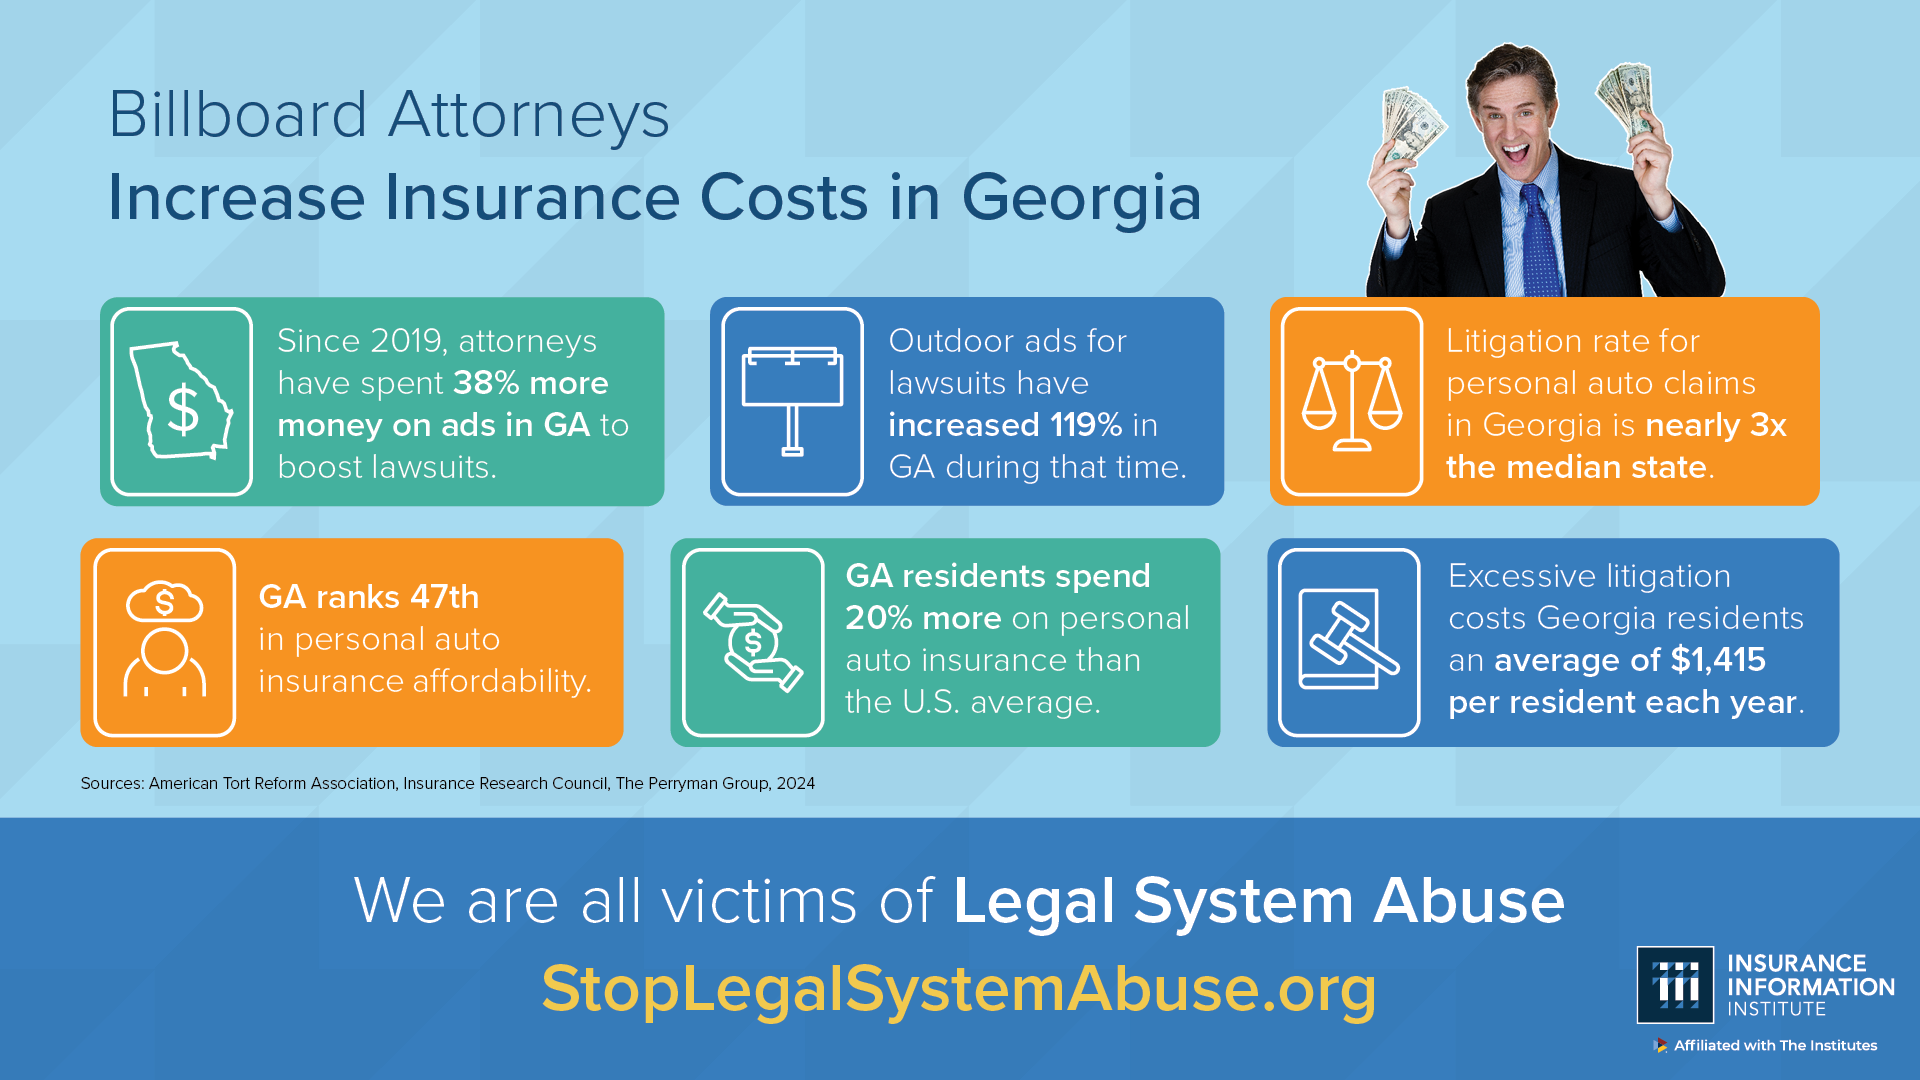
Georgia loses over 137,000 jobs annually due to excessive litigation, which further imposes an estimated $1,415 “tort tax” on each resident per year, earning the state a recurring spot on the American Tort Reform Foundation’s annual list of “judicial hellholes.” With litigation for personal auto claims at a rate more than twice that of the median state, Georgia also ranks among the least affordable states for personal auto insurance, according to research by the Insurance Research Council (IRC) – an affiliate of The Institutes, like Triple-I.

To bolster stakeholder education on the economic impacts of legal system abuse, Triple-I recently expanded its comprehensive awareness campaign in Georgia. The campaign now encompasses multiple brick-and-mortar interstate billboards in Downtown Atlanta, along with digital bus shelter billboards across the Metro Atlanta area. All billboards promote Triple-I’s microsite encouraging consumer support for reform in the state.

Though hundreds – including doctors and business owners – have galvanized behind the reforms, neither bill is without controversy. Opponents argue such legislation may not improve insurance rates and could overcorrect to favor insurance companies at the expense of policyholders.

Following reforms in 2022 and 2023, however, Florida welcomed flat or decreased insurance rates last year, as the state’s insurance market began to recover from its former status as the “poster child” for legal system abuse. Substantial rate reductions have continued into 2025, particularly for three major auto insurance carriers, according to Florida Gov. Ron Desantis’ announcement earlier this month.

While the specific policy levers may differ, Florida’s success models the potential benefits of similar legislation in other areas. Certainly, understanding and mitigating these trends is crucial to restoring Georgia’s economy.

Learn More:

New Triple-I Issue Brief Puts the Spotlight on Georgia’s Insurance Affordability Crisis

How Georgia Might Learn From Florida Reforms

Triple-I launches Campaign to Highlight Challenges to Insurance Affordability in Georgia

Georgia Is Among the Least Affordable States for Auto Insurance

Severe Convective Storm Risks Reshape U.S. Property Insurance Market

Downtown Houston buildings with damaged windows from derecho

Severe convective storms (SCS) are emerging as a major driver of U.S. property insurance costs, with large hail events alone damaging nearly 600,000 homes in 2024, according to an analysis by CoreLogic.

SCS weather events, which include damaging hail, tornadoes, straight-line winds and derechos, are becoming a significant driver of insured natural disaster losses across the U.S. While hurricanes and wildfires often receive more attention, these intense storms are causing considerable damage, CoreLogic noted.

Scale of Current Damage

In 2024, damaging hail of two inches or greater affected 567,000 single- and multifamily homes across the contiguous U.S. The combined reconstruction cost value (RCV) of these properties is approximately $160 billion. Texas, Nebraska, Missouri, Oklahoma, and Kansas account for 72% of the homes at risk for damaging hail.

The pattern of these storms is shifting. While 2024 saw 133 days of damaging hail—above the 20-year average of 121 days—storm activity is evolving. Rather than extended periods of severe weather, there’s a trend toward more concentrated events, the report explained.

These localized storms can strain resources and claims processing systems, creating challenges for insurers and claims managers. On Sept. 24, a single event in Oklahoma City damaged 35,000 homes, making it the most impactful single hail event of 2024. A derecho that struck Downtown Houston last May caused more damage to “hurricane-proof” buildings than Hurricane Beryl in July, according to a recent study.

Property at Risk from SCS

Hailstorms pose a threat to 41 million homes at moderate or greater risk, representing a reconstruction cost value (RCV) of $13.4 trillion, according to CoreLogic’s risk score models. For tornadoes, 66 million homes are at risk, valued at $21 trillion RCV. Straight-line winds affect 53 million homes with an RCV of $18.6 trillion.

Texas, with 8.1 million homes at moderate or greater risk, has the highest concentration of risk across all storm categories, due to its size and geographic position, according to CoreLogic. The Central U.S. shows the highest overall concentration of SCS risk.

Chicago is the metropolitan area most at risk in all three SCS risk categories, with approximately 3 million homes at risk for each type of severe weather event, the report found. For tornado risk, Dallas and Miami follow Chicago as the most exposed urban centers.

Changing Environmental Conditions

Warmer sea surface temperatures and increased atmospheric moisture are altering storm patterns, according to CoreLogic. The traditional SCS season is expanding, with storms appearing earlier in spring and continuing later into fallTornado impacts are also shifting much further east than historical norms, impacting Midwest states such as Illinois, Indiana, Michigan and Ohio.

Analysts have examined three greenhouse gas emissions representative concentration pathways (RCPs): RCP 4.5, 7.0, and 8.5, projecting outcomes through 2030 and 2050, the report noted. These scenarios indicate a shifting geography of SCS risk, with the South and Midwest facing projected increases.

By 2050, the South and Midwest are expected to see increased SCS activity, including large hail, strong winds, and tornadoes, the analysis found. This shift correlates with elevated atmospheric instability, particularly in higher emissions scenarios.

For the insurance sector, these projections indicate a need for refined risk models and improved infrastructure in emerging high-risk areas. Geographic risk exposure management will become increasingly important as SCS events evolve, according to CoreLogic.

View the full SCS report here.

IRC report reveals that one in three drivers were either uninsured or underinsured in 2023. 

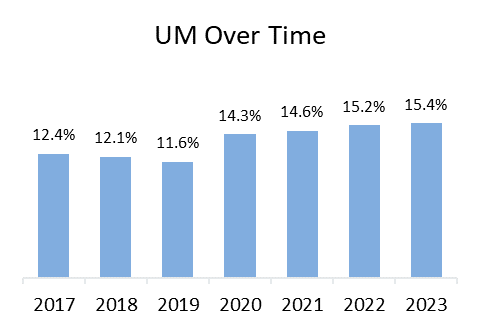
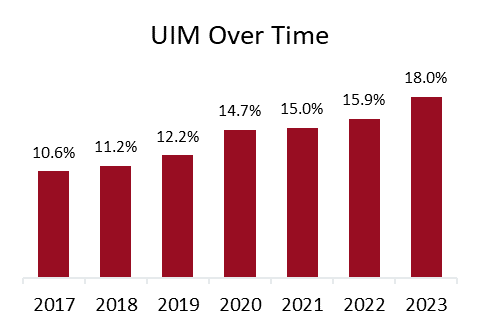
In 2023, despite nearly universal legal requirements to have auto insurance, more than one in seven drivers (15.4 percent) nationally were uninsured, and more than one in six drivers (18.0 percent) were underinsured, according to the new report, Uninsured and Underinsured Motorists: 2017–2023, by the Insurance Research Council (IRC), affiliated with The Institutes. Across the fifty states and the District of Columbia, one in three drivers (33.4 percent) were either uninsured or underinsured in 2023, a 10 percentage point increase in the combined rate since 2017.  

Using data submitted by 17 insurers — representing approximately 55 percent of the private passenger auto insurance market countrywide — this latest report estimated the prevalence of uninsured (UM) and underinsured (UIM) by comparing the frequency of UM claims and UIM claims, respectively, to the frequency of bodily injury (BI) claims. Findings included an analysis of trends and contributing factors to variations in UM and UIM rates across states. 

The IRC analyzed UM, UIM, and BI liability exposure and claim count data from participating companies for 2017 through 2023. Because of the disruption of the pandemic shutdowns, the changes over time were split into three periods (details outlined in the report).  

Key IRC findings include:  

  • UM rates varied substantially across the nation (50 states and the District of Columbia) 
  • Nearly every state saw a rise in the UM rate in 2020 with the onset of the pandemic, but the experience from 2020 to 2023 was mixed.  
  • Every state, except for New York and the District of Columbia, experienced a rise in UIM rate between 2017 and 2023.  
  • Many states with high UM rates often also have high UIM rates. However, some jurisdictions, such as Nevada and Louisiana, combine below-average UM rates with high UIM rates, while others, such as the District of Columbia, have high UM rates but low UIM rates.  
  • Several factors, including economic factors, insurance costs, and state insurance laws and regulations, are associated with variations in UM and UIM rates across states. 

After the initial shock of the pandemic, the UM rate increased steadily. 

Before the disruption of the COVID-19 pandemic, UM rates were falling in most states. From 2017 to 2019, only 11 jurisdictions saw an increase. UM claim frequency fell slightly in 2020 to 0.11 claims per 100 insured vehicles, but the decline was much smaller than the drop in BI claim frequency. UM claim frequency recovered quickly and, in the years since 2020, has grown faster than BI claim frequency (39 percent compared with 29 percent).   

As a result, the UM rate has increased steadily, reaching 15.4 percent in 2023. The range of the UM rates spanned from a low of 5.7 percent in Maine to a high of 28.2 percent in Mississippi. Outliers include eight states with UM rates above 20 percent and 11 states with rates lower than 10 percent.  

States with above-average BI claim frequency and UM claim frequency tended to have higher UM rates. Yet, some states with low UM claim frequency rates have a relatively high UM rate. In Michigan, for example, strict no-fault rules limit the number of BI claims, so the ratio of UM-to-BI claim frequencies is high. Lower UM rates tended to occur in states with higher income, lower unemployment rates, lower insurance expenditures, low minimum limits, and a lack of stacking provisions.  

UM rates were higher in states that don’t require UIM coverage. In 2023, the UM rate was 14.9 percent in states that do not require UIM insurance, compared with 11.6 percent in states that require it. Where UIM coverage isn’t required by law, UM rates were significantly higher in the years captured in this study, with the rate in 2023 at 18.9 percent in states that don’t require UIM insurance, compared with 13.3 percent in states that require it.   

Nearly one in five accidents with injuries involved losses more than the at-fault driver’s coverage limits. 

Over the study period, nearly every jurisdiction experienced an increase in its UIM rate. The only exceptions were a small decline (0.9%) in the District of Columbia and a 6.6 percent decline in New York. The largest increase occurred in Colorado, where the UIM rate rose 24.4 percentage points. Other states with above-average increases included Michigan, Kentucky, and Georgia.  

UIM claim frequency showed a small increase between 2017 and 2019 before dropping slightly in 2020. In the years since the onset of the pandemic, with the severity of auto injury claims on the rise, UIM claim frequency has increased markedly, reaching 0.17 claims per 100 insured vehicles in 2023. Since 2020, the growth in UIM claim frequency was double the growth in BI frequency. As a result, the UIM rate has increased significantly, rising to 18.0 percent in 2023.  

IRC analysis showed that characteristics associated with lower UIM rates included higher income, lower unemployment rates, lower insurance expenditures, high or medium minimum limits, lack of stacking provisions, and use of a limits trigger for UIM coverage rather than a damages trigger. States with high UM rates often also have high UIM rates. Florida, Colorado, and Michigan all rank relatively high for both measures, while Maine, Massachusetts, and Nebraska all rank relatively low.  

“The increase in UIM rates points to higher UIM premiums in the future, worsening affordability and potentially increasing the likelihood of more uninsured drivers. This demonstrates the complex interconnectedness of these two coverages as insurers protect consumers from insufficient coverage by at-fault drivers,” said Dale Porfilio, president of the IRC and chief insurance officer at the Insurance Information Institute (Triple-I). 

While state laws regarding mandatory requirements for uninsured and underinsured motorists vary, nearly all states have a legislation framework that requires all drivers to have some auto liability insurance to drive a motor vehicle. Drivers in most states are also required to purchase additional protection to provide coverage if the at-fault driver cannot afford to pay for the damage they caused. However, legislators in several states have enacted “no pay, no play” laws, which ban uninsured drivers from suing for noneconomic damages such as pain and suffering. A handful of states have programs to assist lower-income drivers, and drivers can check with their state’s insurance division to see if they are eligible.  

To learn more about UM/UIM trends, read the IRC report, Uninsured and Underinsured Motorists: 2017–2023, and check out the Triple-I Backgrounder on Compulsory Auto/Uninsured Motorists

South Carolina Analysis Shows Liquor Liability Insurance Market in Crisis

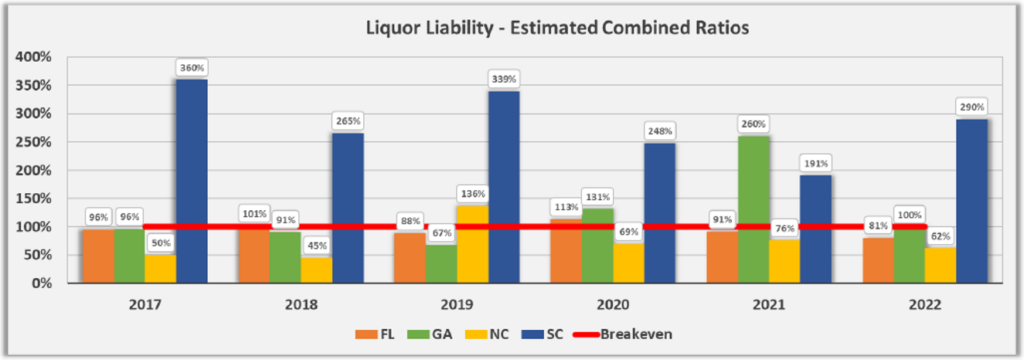
South Carolina’s liquor liability insurance market is in crisis, with insurers losing an average of $1.77 for every $1.00 of premium earned since 2017, while claim frequencies significantly outpace neighboring states, according to a recent study by the state’s Department of Insurance.

The comprehensive analysis, initiated following a 2019 request by the South Carolina Senate Judiciary Committee, reveals a deeply troubled marketplace where insurers are losing money.

“The data seem to confirm the anecdotal assertions, made by both insurance companies and small businesses, of a very troubled and challenged marketplace,” the report stated.

Current Market Landscape

The liquor liability insurance market in South Carolina has maintained a relatively stable number of participants in recent years. Since 2019, the number of insurance groups operating in this sector has held steady at around 48 participants. This consistency in market players suggests a mature, albeit challenging, insurance environment.

Despite the overall stability in participant numbers, the market is characterized by the dominance of three major insurance groups.

Premium Trends

While the number of market participants has remained relatively constant, earned premiums have experienced remarkable growth over a five-year period. From 2017 to 2022, earned premiums in the South Carolina liquor liability insurance market more than doubled to $17.0 million from $7.6 million.

This dramatic surge in premiums can be attributed to various factors, but rising insurance rates play a crucial role, the report noted.

Profitability Crisis in South Carolina

Since 2017, liquor liability insurers have lost about $1.77 for every $1.00 of premium earned over the six years observed. In the best performing of those six years (2018), the industry lost roughly $0.91 per $1.00 of premiums earned, while losing about $2.60 per $1.00 of premiums earned in the worst performing year, 2022.

“Combined ratios for the industry make it clear that this sub-line of insurance is being written at massive underwriting losses,” the report’s authors stated.

Source: South Carolina Department of Insurance

The severity of South Carolina’s liquor liability insurance crisis becomes even more apparent when compared to their neighboring states, where these same insurers have realized a net profit over time, the report noted.

Over the same 2017-2022 period analyzed, for example, North Carolina’s estimated liquor liability combined ratio ranged between 45% and 76%. In 2022, when South Carolina’s estimated combined ratio hit 290%, North Carolina’s stood at 62%.

Claims Severity and Frequency

The liquor liability insurance market in South Carolina also has experienced significant fluctuations in claim severity over recent years. In 2022, the average incurred claim per $1 million of earned premium reached $281,071, a substantial increase from $121,761 the previous year. This figure, however, falls within a broader historical context of volatility. The state witnessed its highest average claim of $338,244 in 2017, followed by a dramatic drop to $121,761 in 2021.

Despite these fluctuations, recent data suggests that South Carolina’s claim severity is aligning more closely with neighboring states in recent years, according to the report.

While severity trends show signs of alignment with regional norms, claim frequency in South Carolina presents a more pressing challenge.

From 2019 to 2022, South Carolina’s claim frequency (number of incurred claims per $1 million of earned premium) has outpaced that observed in the other states considerably. The claims frequency rate was nine in 2022, 13 in 2021, 10 in 2020 and 12 in 2019. During that same period, none of its neighboring states — Florida, Georgia and North Carolina — reported a claims frequency rate higher than five.

View the full South Carolina report here.

Executive Exchange: Insuring AI-Related Risks

By Lewis Nibbelin, Contributing Writer, Triple-I

Garnering millions of weekly users and over a billion user messages every day, the generative AI chatbot ChatGPT became one of the fastest-growing consumer applications of all time, helping to lead the charge in AI’s transformation of business operations across various industries worldwide. With generative AI’s rise, however, came a host of accuracy, security, and ethical concerns, presenting new risks that many organizations may be ill-equipped to address.

Enter Insure AI, a joint collaboration between Munich Re and Hartford Steam Boiler (HSB) that structured its first insurance product for AI performance errors in 2018. Initially covering only model developers, coverage expanded to include the potential losses from using AI models, as – though organizations might have substantial oversight in place – mistakes are inevitable.

“Even the best AI governance process cannot avoid AI risk,” said Michael Berger, head of Insure AI, in a recent Executive Exchange interview with Triple-I CEO Sean Kevelighan. “Insurance is really needed to cover this residual risk, which…can further the adoption of trustworthy, powerful, and reliable AI models.”

Speaking about his team’s experiences, Berger explained that most claims stem not from “negligence,” but from “data science-related risks, statistical risks, and random fluctuation risks, which led to an AI model making more errors than expected” – particularly in situations where “the AI model sees more difficult transactions compared to what it saw in its training and testing data.”

Such errors can underlie every AI model and are thereby the most fundamental to insure, but Insure AI is currently working with clients to develop coverage for discrimination and copyright infringement risks as well, Berger said.

Berger also discussed the insurance industry’s extensive history of disseminating technological advancements, from helping to usher in the Industrial Revolution with steam-engine insurance to insuring renewable energy projects to facilitate sustainability today. Like other tech innovations, AI is creating risks that insurers are uniquely positioned to assess and mitigate.

“This is an industry that’s been based on using data and modeling data for a very long time,” Kevelighan agreed. “At the same time, this industry is extraordinarily regulated, and the regulatory community may not be as up to speed with how insurers are using AI as they need to be.”

Though they do not currently exist in the United States on a federal level, AI regulations have already been introduced in some states, following a comprehensive AI Act enacted last year in Europe. With more legislation on the horizon, insurers must help guide these conversations to ensure that AI regulations suit the complex needs of insurance – a position Triple-I advocated for in a report with SAS, a global leader in data and AI.

“We need to make sure that we’re cultivating more literacy around [AI] for our companies and our professionals and educating our workers in terms of what benefits AI can bring,” Kevelighan said, noting that more transparent discussion around AI is crucial to “getting the regulatory and the customer communities more comfortable with how we’re using it.”

Learn More:

Insurtech Funding Hits Seven-Year Low, Despite AI Growth

Actuarial Studies Advance Discussion on Bias, Modeling, and A.I.

Agents Skeptical of AI but Recognize Potential for Efficiency, Survey Finds

Insurers Need to Lead on Ethical Use of AI

Insurtech Funding Hits Seven-Year Low,
Despite AI Growth

Global insurtech funding hit a seven-year low of $4.25 billion in 2024, marking a challenging year for the sector, though AI-focused companies showed resilience by securing $2.01 billion across 119 deals, according to Gallagher Re’s Global Insurtech Report. 

Total insurtech funding in 2024 — down 5.6 percent from $4.51 billion in 2023 — represents the lowest funding level since 2018, signaling a more cautious investment climate. Last year’s insurtech deal count saw a more pronounced decline, falling 18.5 percent to 344 deals from 422 in the previous year — a low not seen since 2019. Reflecting this trend, the number of venture investors in the space decreased to 466 from 574, indicating a more selective approach to insurtech investments. 

Segment Performance 

A closer look at the market segments reveals divergent trajectories, Gallagher Re found. Property/Casualty (P/C) insurtech funding experienced a significant downturn, decreasing 24.3 percent to $2.59 billion in 2024 from $3.42 billion a year earlier. In contrast, Life/Health insurtech funding bucked the overall trend, surging by 53.6 percent to reach $1.66 billion. 

Despite an overall funding contraction, several positive indicators emerged, suggesting underlying strength in the market, the report noted. 

Early-stage funding grew by 8.8 percent to $1.22 billion, highlighting continued investor confidence in nascent insurtech innovations. Moreover, the average deal size increased by 14.6 percent to $14.67 million, indicating that while fewer deals were made, those that did close were of higher value. 

Lastly, mega-round funding — deals of $100 million or more — remained relatively stable at $930.17 million, down only slightly from $969.00 million in 2023. 

Geographic Shifts and Market Leadership 

The United States continues to be the powerhouse of insurtech innovation, accounting for 50.58 percent of all insurtech deals worldwide in 2024. 

The United Kingdom saw a significant increase in its deal share, rising to 9.30 percent in 2024 from 7.35 percent in the previous year. This growth of nearly two percentage points represents the largest gain among all countries. Moreover, the U.K. has consistently maintained its status as the nation with the second-largest share of global insurtech deals since 2017. 

While established markets continue to lead, several emerging players are making their mark on the insurtech landscape. Canada and Germany both demonstrated growth, each experiencing a 1.78 percentage point increase to claim a 3.20 percent share of global deals. South Korea is another country to watch, with its deal share increasing by 1.21 percentage points to reach 1.45 percent. 

AI-centered Insurtech Performance 

Artificial Intelligence continues to make waves in the insurtech industry, accounting for a significant portion of deals and funding in 2024. AI-focused firms represented 34.6 percent of all insurtech deals throughout the year, raising $2.01 billion across 119 deals. The financial prowess of AI-centered insurtechs is further highlighted by their higher average deal sizes, which stood at $18.93 million compared to $12.21 million for their non-AI counterparts. 

The fourth quarter of 2024 saw a particularly strong performance for AI in the insurtech space. AI-centered companies accounted for 42.3 percent of all deals during this period, showcasing the growing confidence in AI-driven solutions. Moreover, these AI-enabled insurtechs managed to raise an additional $5 million on average compared to their non-AI counterparts, further cementing the technology’s value proposition in the industry. 

While the numbers paint a promising picture, Gallagher Re emphasized the need for practical applications of AI in insurance. 

“Much like insurtech more broadly, AI must be part of a use case that is commercially sound and supports a broader set of business objectives,” the report stated. “Using AI to assist underwriters to make better risk selection decisions is one such clear use case, for example. Using AI to send customers down company rabbit holes where call centers once existed is not.” 

Learn More: 

Human Needs Drive Insurance and Should Drive Tech Solutions 

Actuarial Studies Advance Discussion on Bias, Modeling, and A.I. 

Agents Skeptical of AI but Recognize Potential for Efficiency, Survey Finds 

Insurers Need to Lead on Ethical Use of AI 


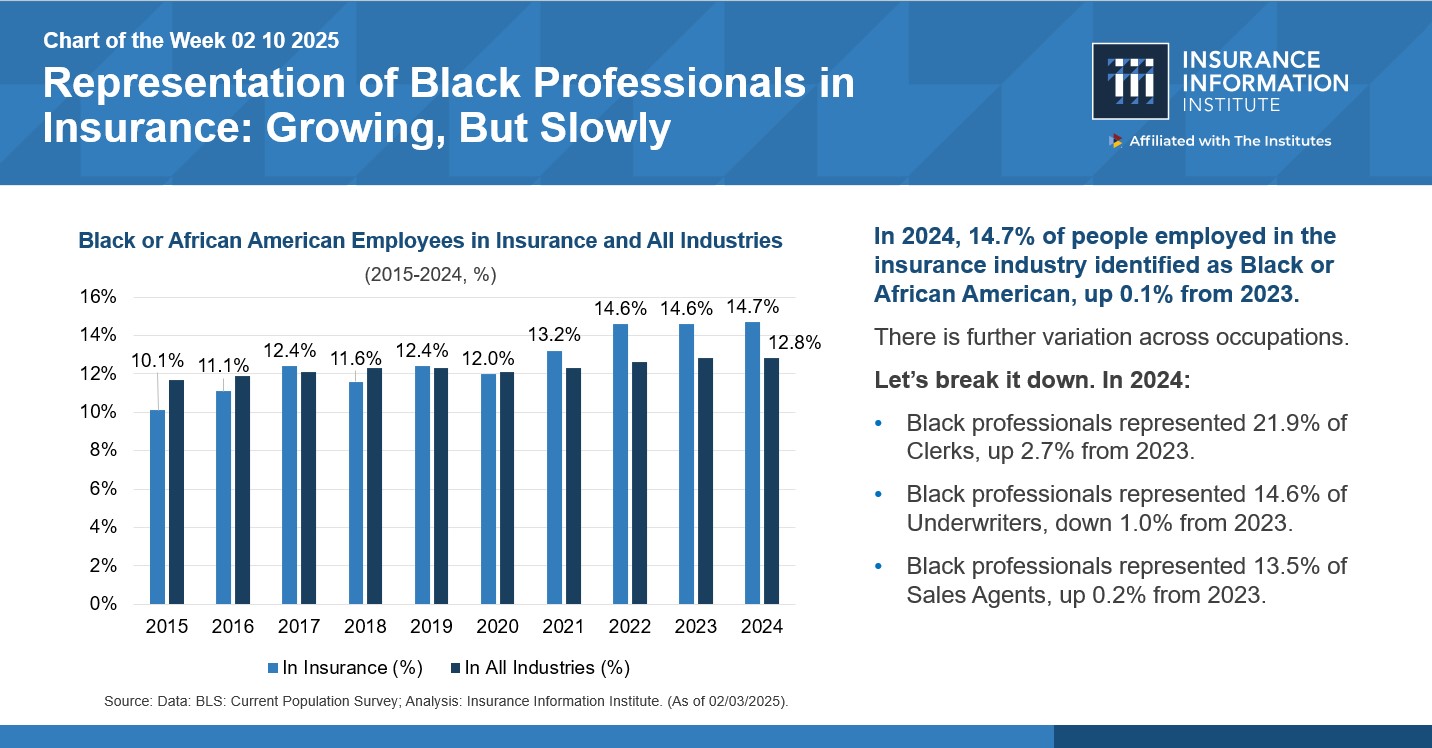
Triple-I Chart of the Week, Representation of Black professionals in Insurance: Growing, But Slowly

On February 10, Triple-I released its latest Chart of the Week (COTW), “Representation of Black professionals in Insurance: Growing, But Slowly.” Citing data from the Bureau of Labor Statistics, the chart reveals that in 2024, Black professionals comprised 14.7 percent of the insurance industry, just a 0.1 percent increase from 2023 but still considerably up from 9.9 percent a decade ago. Triple-I’s snapshot shows some occupation categories: underwriters comprised 14.6 percent, agents 13.5 percent, and claims and policy processing clerks 21.9 percent.

The most recent BLS data also shows Black representation among claims adjusters, appraisers, examiners, and investigators is at 20.9 percent. Last year’s version of the chart revealed (using data from 2020) that Black professionals accounted for only 1.8 percent of senior executives at the top ten US insurers. (In 2024, Black CEO representation across the Fortune 500 was only 1.6 percent, an all-time high.) Overall, insurers have welcomed Black professionals at proportions commensurate with their proportion of the overall US workforce but have not managed to make headway in the C-suite.

According to BLS data cited in an AM Best report, total employment in the industry had surpassed 3 million by August 2023. However, employers could face massive attrition as thousands of workers (along with their leadership skills and knowledge) retire from the workforce in the coming years.

Attracting and retaining top talent remains a key business strategy for organizations that want to keep delivering world-class results and growth. As the insurance industry collects revenues from virtually every household in America, a workforce that reflects this enormous marketplace can tap into a diversity of thought and experience to help address the industry’s challenges, including making products affordable and available to cover a broad range of risks.

A Boston Consulting Group study revealed that companies with above-average diversity in their leadership teams reported innovation revenue at rates 19 percentage points higher than those with below-average diversity in management. Again, the ability of the industry’s aging workforce to connect with younger generations will be pivotal. US millennials and Gen Zers command nearly $3 trillion in spending power each year.

Progress towards diverse talent recruitment and retention goals can hinge upon cultivating a workplace where all employees feel welcome, supported, fulfilled, and empowered to keep growing professionally. Nonetheless, a lack of diversity at the C-suite level can undermine efforts to incorporate driven and career-focused candidates, especially among millennials and GenZ professionals. Rising generations are wary of glass ceilings and may want proof that inclusion and equity come from the top.

Data indicates that companies tend to employ Black professionals more often in jobs that don’t typically lead to higher roles instead of taking deliberate and strategic efforts to increase Black representation in areas close to centers of profit and strategic decision-making. These employees are taken out of the line of sight for getting tapped and groomed for opportunities that can lead to the C-suite. Insurers keen on Black talent development can open opportunities for Black employees to learn about what’s above that mid-level management ceiling and make connections. Organizations such as Black Insurance Industry Collective (BIIC) offer this and other types of strategic assistance to the industry for advancing, retaining, and empowering Black talent at the executive level.

“The momentum is clear—BIIC is not just shaping the conversation but actively driving meaningful change within the insurance industry,” says Amy-Cole Smith, Executive Director for BIIC and Director of Diversity at The Institutes.

Since its inception three years ago, BIIC has endeavored to support Black leaders within the risk management and insurance industry in full partnership with some of the largest insurance organizations. To date, 22 organizations have joined forces with BIIC to advance this mission.

Cole-Smith says, “By fostering mentorship, leadership development, and strategic networking opportunities, BIIC is creating tangible pathways for Black professionals to ascend into executive roles, influence key industry decisions, and pave the way for future generations.”

In addition to engaging over 4,000 professionals through its bespoke content designed to raise awareness and foster discussion of key topics relevant to this mission, BIIC has also supported over 135 emerging, mid-level, and senior Black professional leaders through its Executive Leadership Program, a collaboration with Darden Executive Education and Lifelong Learning. 

“Through its commitment to equity, inclusion, and professional excellence, BIIC is not only elevating individual careers but also transforming the industry’s leadership landscape, ensuring that diverse perspectives and voices shape its future,” according to Cole-Smith.

Workers Comp Premium, Loss, Market Trends Support Its Ongoing Success

By William Nibbelin, Senior Research Actuary, Triple-I

The workers compensation insurance industry experienced its second-best underwriting result in the past 20 years in 2023, with a net combined ratio of 87, according to Triple-I’s latest Issues Brief. It was the ninth year in a row of net underwriting profit following eight years of net underwriting losses.

Combined ratio – the most common measure of insurer underwriting profitability – is calculated by dividing the sum of claim-related losses and expenses by premium. A combined ratio under 100 indicates a profit. A ratio above 100 indicates a loss. Net combined ratio and net written premium growth rates for Workers Comp are analyzed, forecasted, and reported in Triple-I quarterly members-only webinars. Workers comp has outperformed the combined property and casualty insurance industry in net combined ratio each year since 2015.

Triple-I’s brief provides research results on trends contributing to recent success in workers comp, including employment, wages, claim frequency and severity, and market competition.

Workers comp premiums declined drastically in 2020 as the onset of the COVID-19 pandemic resulted in a reduction of employment across the U.S. The 2020 annual change in employment measured by total non-farm payroll of -5.8 percent was the only negative change since 2010. Despite this decrease, the annual compound increase in total non-farm payroll from 2010 to 2023 has been a steady 1.3 percent.

Using total non-farm payroll as the basis for exposure and reported claims at 12 months from S&P Global Market Intelligence by year, workers comp frequency has been declining steadily from 2014 to 2023 at an annual compound rate of negative 5.1 percent.

Using net ultimate loss and defense and cost containment at 12 months divided by reported claims, workers comp severity has been increasing at an annual compound rate of 4.4 percent from 2014 to 2023. However, using nominal GDP as the basis of severity similar to frequency, severity has been decreasing at the opposite rate of negative 4.4 percent. This is indicative of a severity pattern influenced more by increasing inflation than underlying historical cost trends.

New Triple-I Issue Brief Puts the Spotlight on Georgia’s Insurance Affordability Crisis

Insurance affordability in Georgia is dwindling as claim frequency and insurer costs soar, according to the latest issue brief from Insurance Information Institute (Triple-I), Trends and Insights: Georgia Insurance Affordability.  

Given the state’s below-average income vs. above-average insurance expenditures, Georgia ranks 42nd on the list of affordable states for homeowners insurance and 47th (plummeting from the 2006 high of 27th) for personal auto affordability, according to reports by the Insurance Research Council. This brief provides an overview of how several factors, including skyrocketing costs from litigation, pose risks to coverage affordability, availability, and other potential economic outcomes for Georgia residents. Tort reform is discussed as a legislative solution to the challenge of legal system abuse – excessive policyholder or plaintiff attorney practices that increase costs and time to settle insurance claims. 

The Georgia insurance market grapples with multiple risk factors 

From 1980–2024, Georgia was impacted by 134 confirmed weather/climate disaster events in which losses exceeded $1 billion each. At least 38 of those events happened in the last five years, with 14 in 2023. Homeowners in Georgia’s most climate-risk-vulnerable counties, such as the coastal and most southern parts of the state, can face double-digit premium hikes or nonrenewals. Also, data indicates the rate of underinsured motorists in Georgia is twice as high as the national average, and the rate of uninsured motorists is 25 percent higher. Injury claim severity in the state is slightly higher than in the rest of the country.   

Data indicates that litigation costs have become a pervasive concern for risk management. 

Rising claim frequency and litigation costs put coverage affordability and availability at risk. For example, the IRC findings across personal auto lines show a dual trend in Georgia of increased claims and litigation. Property damage liability claims per 100 insured vehicles are 15 percent higher, and relative body injury claims frequency is 60 percent higher. According to IRC, the rate for private passenger litigation in Georgia is nearly three times that in the median state. 

The Georgia Office of Commissioner of Insurance and Safety Fire (“OCI”) reviewed all lines across personal and commercial auto, personal and commercial umbrella, and commercial general liability (homeowners liability was excluded). The five-year average count for liability claims increased 24.9 percent (2014 – 2018 at 583,756 vs. 2019-2023 at 729,191). A rising percentage of claims with payment are full-limit claims, and the OCI analysis indicates litigation is driving that increase. While costs rose for both litigated and non-litigated claims, the number of claims with legal involvement dominated paid indemnity for most lines of business, and litigated claims comprised a growing portion of the total paid indemnity. 

Attorneys appear to have revved up their mining for lawsuits in Georgia. Law firms spent $160 million on advertising in Georgia, according to preliminary data from the American Tort Reform Association (ATRA). Outdoor ads for lawsuits increased by 119 percent in GA during that time. It might not be a surprise then to see that the Georgia OCI report shows legal (attorney involved) claims dominated Personal Auto claims for Bodily Injury, comprising 62 percent of claims and 86 percent of total indemnity paid for closed claims in Accident Year 2023. A review of losses of $1 million or more by accident year that have closed during the 2014 to 2023 period shows that each accident year cohort surpasses the count from the previous accident years.   

Recently introduced state tort reform legislation may help to stabilize insurance costs. 

Analysts estimate that litigation costs Georgia residents $880 million annually, or an average of $1,415 per resident.  Sean Kevelighan, Triple-I CEO, says “understanding how these trends drive up costs and identifying policy levers for tort reform legislation can ultimately bring positive outcomes for Georgia’s economy and its consumers and business owners.” 

As part of our commitment to educating stakeholders, Triple-I has launched a multi-faceted campaign to raise awareness of the mounting costs of legal system abuse in Georgia and other states. We invite you to view the video statement by our CEO Sean Kevelighan, interviews capturing the opinions of consumers about legal system abuse, and read the full issue brief, Trends and Insights: Georgia Insurance Affordability. 

Parametric Insurance Gains Traction Across U.S.

By Lewis Nibbelin, Contributing Writer, Triple-I

Heading into 2025, countless communities are still grappling with the $27 billion natural disasters that impacted the United States last year – a total driven by costly storms and severe inland flooding. Many affected residents lacked flood coverage and will rely almost exclusively on federal relief funding to recover, underscoring a widespread protection gap.

Aiming to expedite disaster recovery for riverine communities in the Mississippi River Basin, the Mississippi River Cities and Towns Initiative (MRCTI) recently announced a flood insurance pilot currently in development with Munich Re that will use parametric insurance.

Unlike traditional indemnity insurance, parametric structures cover risks without sending adjusters to evaluate post-catastrophe damages. Rather than paying for specific damages incurred, parametric policies issue agreed-upon payouts if certain conditions are met – for example, if wind speeds or rainfall measurements meet an established threshold. Speed of payment and reduced administration costs can ease the burden on both insurers and policyholders, especially as weather and climate risks become more severe and unpredictable.

Several insurers demonstrated this efficiency in the wake of last year’s hurricanes – among them climate risk-management firm Arbol, which paid out $20 million in parametric reinsurance claims within 30 days after Milton made landfall.

Coast-to-coast trends

Though the MRCTI pilot presents a novel approach to inland flooding, similar pilots are already underway along the coast. New York City developed its own parametric flood program following Superstorm Sandy to bolster the resilience of low- and moderate-income neighborhoods struggling to recover. The program received enough funding last year not only for renewal but expansion, bringing needed protection to even more vulnerable communities.

For flood-prone Isleton, Calif. – a small Sacramento County town that lacks the resources to support a police department – risk mitigation has long taken a backseat to more immediate concerns. But the city’s location in a floodplain made it the perfect candidate for California’s parametric flood pilot, backed by a two-year, $200,000 grant going into effect this year.

The emergence of these community flood solutions reflects a growing interest in parametric insurance throughout the U.S., which propelled the $18 billion value of the global parametric insurance market in 2023. From Lloyd’s first dedicated parametric syndicate to Amwins’ parametric program for golf courses, more parametric coverage options are available than ever before, particularly after numerous private carriers – emboldened by improved data analytics and modeling – expanded their parametric flood insurance business in the U.S. last year.

Take FloodFlash, a leading parametric flood insurance provider based in London. Initially limited to five states, FloodFlash became known for offering coverage beyond the National Flood Insurance Program’s (NFIP) limits and in areas traditionally unsupported by private markets. Increased broker demand motivated the company, in partnership with Munich Re, to gradually roll out coverage to all mainland states last year, ahead of active hurricane season forecasts.

New insurance startups like Ric are also lowering the cost of entry into innovative parametric-based resilience. A winner of the RISE Flood Insurance of the Future Challenge, Ric will launch later this year on the coasts with micro-policies ranging from $14 to $50 per month. The company plans to collaborate with employers to extend their policies as employee benefits, which could help raise awareness of and reduce coverage gaps.

Regulatory momentum

As parametric risk transfer continues to gain traction, regulatory uncertainty in the absence of corresponding insurance laws persists. Given that many jurisdictions have structured their legal insurance framework around traditional indemnity principles, it’s unclear how restrained insurers in some areas are to issuing payouts only for actual losses.

Determining appropriate thresholds for coverage poses another challenge. For example, following extensive devastation from Hurricane Beryl last year, a $150 million parametric catastrophe bond did not yield a payout because air pressure levels narrowly missed the predefined minimum. The ensuing backlash included an intergovernmental “examination” into insurance-linked securities broadly and sparked industry-wide debate surrounding the equity of parametric structures.

To date, only a handful of states have enacted parametric insurance legislation, though substantial movement last year suggests more regulations are on the horizon. Notably, Vermont updated its previous 2022 law permitting captive insurance companies to enter parametric contracts. Based on evidence of their utility as insurance contracts, parametric contracts are now less restricted.

New York also unanimously passed its first parametric insurance law, recognizing parametric coverage as an authorized form of personal line insurance within the state. The law further stipulates mandatory disclosures on all parametric applications that distinguish parametric insurance as less comprehensive, and therefore not a substitute for, traditional property and flood insurance.

Such regulations are a promising step forward towards refining parametric coverage and facilitating its adoption across the country, but tensions between parametric and indemnity risk structures remain largely unresolved. Navigating how parametric insurance functions alone or as part of a package including indemnity coverage will require more collective input from all industry stakeholders.

One thing is for certain: traditional risk-transfer mechanisms are no longer sufficient to address the risk crisis presented by our evolving climate. Tools like parametric insurance – paired with hazard mitigation and community resilience planning – are guiding the way forward.

Learn More:

Rising Interest Seen in Parametric Insurance

Hurricane Delta Triggered Coral Reef Parametric Insurance

Mangrove Insurance: Parametric + Indemnity May Aid Coastal Resilience