

As part of its attack on the risk crisis, Triple-I recently participated in a project led by the National Institute of Building Sciences (NIBS) to develop a roadmap for mitigation investment incentives. The Resilience Incentivization Roadmap 2.0 builds off research NIBS published in 2019 and focuses on urban pluvial flooding, though many of the principles can be applied to riverine and coastal flooding, as well as non-flood perils.
The roadmap draws heavily from voluntary programs that have seen success in the context of other risks – such as the Insurance Institute for Business & Home Safety (IBHS) FORTIFIED Home™ Standard and the California Earthquake Authority’s Brace + Bolt retrofit program.
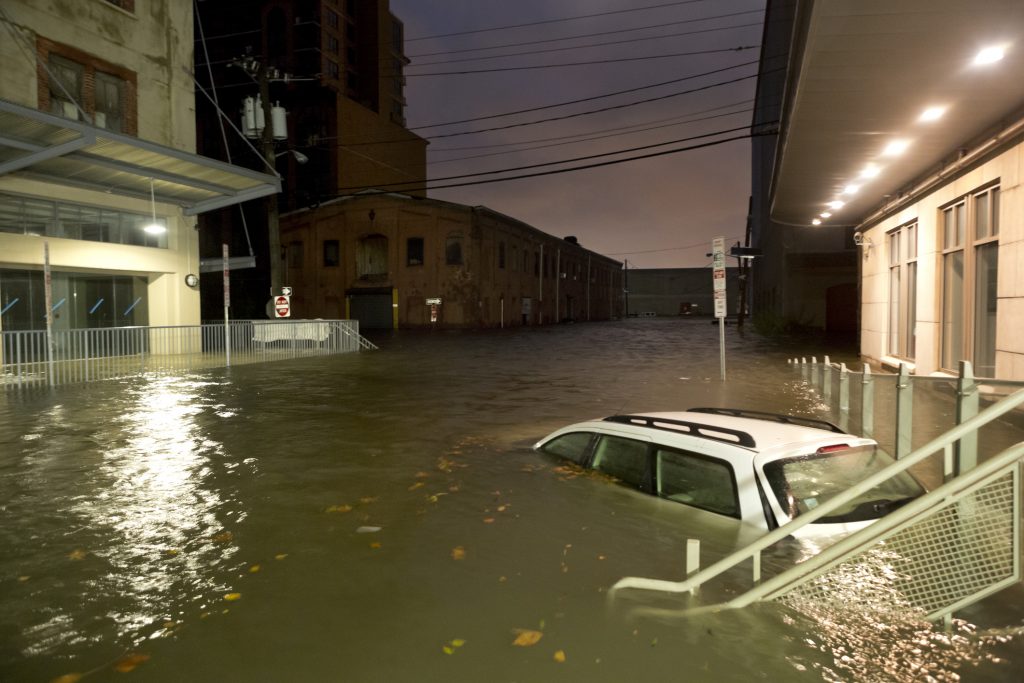
“Pluvial urban flooding” refers to rainwater that can’t flow downhill fast enough to reach streams and stormwater systems and therefore backs up into buildings. Much of the inland flooding caused by Hurricane Ida (2021), Hurricane Ian (2022), and more recent flooding in California due to “atmospheric rivers” and in the Northeast would fall under this category. Common low-cost measures exist to protect buildings from such flooding, and the relative ease and affordability of such mitigations made pluvial urban flooding an appropriate initial target.
This project was a collaboration representing stakeholders in the built environment – lenders, developers, insurers, engineers, agencies, policymakers – with the goal of helping communities develop layered mitigation investment packages. Triple-I’s role was to represent the property/casualty insurance industry as a stakeholder and co-beneficiary of investment in advance mitigation and resilience.
Insurers have strong incentives to encourage policyholders to make improvements that reduce the risk of costly claims. In the case of flood risk – an increasingly expensive peril outside FEMA-designated flood zones – encouraging such improvements is preceded by a different challenge: persuading homeowners to obtain flood insurance.
About 90 percent of U.S. natural disasters involve flooding. Estimates of size of the “flood protection gap” vary widely among experts, but illustrations worth noting include:
- Less than 25 percent of buildings inundated by Hurricanes Harvey, Sandy, and Irma had flood coverage;
- Inland areas hardest hit by the remnants of Hurricane Ida in 2021 were in areas in which less than 2 percent of properties had federal flood insurance;
- In 2022, historic flooding in and around Yellowstone National Park affected areas in which only 3 percent of residents have federal flood insurance; and
- More recently, precipitation from atmospheric rivers affecting the U.S. West Coast has resulted in an unparalleled weather event not experienced in several decades, with much of the activity affecting areas with low flood-insurance purchase rates.
For decades, U.S. insurers considered flood risk “untouchable” because of how hard it is to quantify their risk. As a result, flood is excluded under standard homeowners and renters policies, but coverage is available from FEMA’s National Flood Insurance Program (NFIP) and a growing number of private insurers that have gained confidence in recent years in their ability to underwrite this risk using sophisticated risk modeling.
Consumer research has consistently shown that some of the most common reasons for not buying flood insurance include:
- An erroneous belief that flood risk is covered under standard homeowners insurance;
- If the mortgage lender doesn’t require flood insurance, it must not be necessary; and
- The coverage is too expensive.
The roadmap provides findings and specific recommendations developed by its multidisciplinary team of authors in collaboration with broad and diverse participation of stakeholder group members. The NIBS Committee on Finance, Insurance, and Real Estate (CFIRE) will host a webinar on October 18 to go over these findings and recommendations. In addition, CFIRE chair Dan Kaniewski will be a participant in Triple-I’s November 30 Town Hall: Attacking the Risk Crisis in Washington, D.C.
Learn More:
Triple-I “State of the Risk” Issues Brief: Flood
Shutdown Threat Looms Over U.S. Flood Insurance
FEMA Incentive Program Helps Communities Reduce Flood Insurance Rates for Their Citizens
More Private Insurers Writing Flood Coverage; Consumer Demand Continues to Lag
NAIC Seeks Granular Data From Insurers to Help Fill Local Protection Gaps


